Annual Report PowerPoint Presentation for Companies

3D triangular bar chart in yellow, orange, and blue shades showing monthly data for four categories, on a dark background.
P.ID : 4064
    323 views
    17 Downloads
    Get Custom Slides by Experts
    Instantly Access Templates in PowerPoint

    Editable Company Annual Report PPT Template


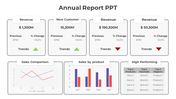
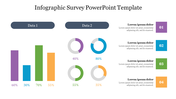
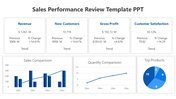
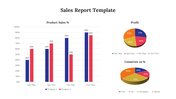
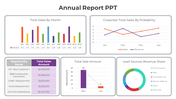
    Unlock strategic insights with our Company Annual Report PowerPoint template and Google Slides Themes. It has a graph showcasing four categories, each represented by three distinct spikes in vibrant colors.  This template offers a visually engaging platform for presenting your company's performance data. Tailored for executives, analysts, investors, and educators, it enables seamless communication of key metrics and trends. Whether analyzing financial results, market share, or operational efficiency, this versatile template ensures your message resonates with clarity and impact. Seamlessly integrate your content with our user-friendly design to create compelling presentations that drive informed decision-making. Elevate your annual reports with our Company Annual Report PowerPoint template and Google Slides Themes, your essential tool for articulating your company's achievements and strategies.

    Features of the template


    • 100% customizable slides are easy to download.
    • Slides are available in different colors.
    • The slide has 4:3 and 16:9 formats.
    • It is easy to change the slide colors quickly.
    • It has a cute design to impress an audience.
    • Create feature-rich, animated presentations.
    Advertisement

    You May Also Like These PowerPoint Templates

    Add to Wishlist
    Download
    AI Customize
    A teal status report slide with a donut chart showing percentages and a table on the right detailing project phases.
    Add to Wishlist
    Download
    AI Customize
    Infographic displaying social media engagement metrics alongside a business-themed illustration.
    Add to Wishlist
    Download
    AI Customize
    Table showing monthly sales data for 2020 with targets, percentage achieved, and status using colored arrows.
    Add to Wishlist
    Download
    AI Customize
    Eye-catching Red PowerPoint Design Slide Templates
    Add to Wishlist
    Download
    AI Customize
    A four column financial report with Q1 to Q4 data, including categories like sales, cost of goods sold, and net profit.
    Add to Wishlist
    Download
    AI Customize
    A colorful Monday weekly planner slide with hourly slots from 7.00 AM to 1.00 PM, a to do list, and text sections.
    Add to Wishlist
    Download
    AI Customize
    Company report slide with a diagonal split design, featuring a tablet displaying analytics and two percentage data sections.
    Add to Wishlist
    Download
    AI Customize
    Work report slide showing hands typing on a laptop, with a coffee cup, notebook, phone, and headphones on a wooden table.
    Add to Wishlist
    Download
    AI Customize
    Weekly report layout PowerPoint slide featuring days of the week and a calendar with placeholder text on a white backdrop.
    Add to Wishlist
    Download
    AI Customize
    Sales report slide with a world map and a ranking table on the right, listing branches, countries, sales, and managers.
    Add to Wishlist
    Download
    AI Customize
    Cute weekly schedule design featuring colorful sticky notes for Monday to Sunday on a purple backdrop.
    Add to Wishlist
    Download
    AI Customize
    A PPT slide showing survey results with bar graphs and financial data on a laptop screen with placeholder text.
    Add to Wishlist
    Download
    AI Customize
    Product sales report slide with a gray monitor illustration and six labeled icons for different item categories.
    Free
    Add to Wishlist
    Download
    AI Customize
    Sales report template featuring a computer monitor in brown and six captions with icons for products.
    Free
    Add to Wishlist
    Download
    AI Customize
    Two percentage sections with construction site images with workers, and a text with title on the right.
    Add to Wishlist
    Download
    AI Customize
    A 3D pie chart with purple, blue, green, teal, and orange segments showing company annual expenses in various categories.