Five Node Company Annual Report PowerPoint Presentation

 Canva
Canva
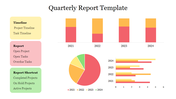

Company Annual Report Presentation
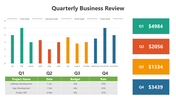
Explore the graphical representation of our success story as it is presented in the company's annual report PowerPoint presentation. Examine significant events and accomplishments using an engaging story that sums up our company's history.
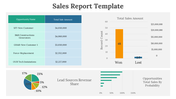
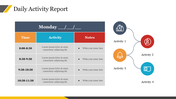
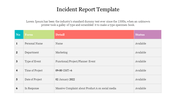
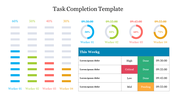
A pie chart with five headers that you can customize is included on one of the important slides. It lets you show different characteristics, including revenue, market share, expenses, and growth areas. Modify each part with ease to create a unique and understandable representation of the financial situation of your business.
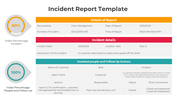
This slide streamlines annual report conversations and is designed with executives, investors, and stakeholders in mind. Its user-friendly design facilitates clear and captivating presentations by making complex data easily understandable, whether in shareholder meetings or financial reviews.
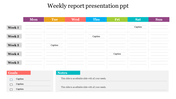
Download our PowerPoint now to improve your annual report presentations. Convert complex data into an engaging business narrative that appeals to both employees and customers.
Features of the Templates
- Completely adaptable.
- The slide show is in 4:3, 16:9, zip format.
- There is powerful connectivity with Google Slides and PowerPoint.
- It is simple and quick to alter the slide's color.
- An efficient template that can be easily accessed immediately.
- Easy to Download.


You May Also Like These PowerPoint Templates
Add to Wishlist
Download
AI Customize

Add to Wishlist
Download
AI Customize

Add to Wishlist
Download
AI Customize

Add to Wishlist
Download
AI Customize

Add to Wishlist
Download
AI Customize

Add to Wishlist
Download
AI Customize

Add to Wishlist
Download
AI Customize

Add to Wishlist
Download
AI Customize

Add to Wishlist
Download
AI Customize

Add to Wishlist
Download
AI Customize

Add to Wishlist
Download
AI Customize

Add to Wishlist
Download
AI Customize

Add to Wishlist
Download
AI Customize

Add to Wishlist
Download
AI Customize

Add to Wishlist
Download
AI Customize

Add to Wishlist
Download
AI Customize

Add to Wishlist
Download
AI Customize

Add to Wishlist
Download
AI Customize

Add to Wishlist
Download
AI Customize

Add to Wishlist
Download
AI Customize
