Annual Report Theme Examples PPT Templates and Google Slides

Annual report slide displaying financial metrics including revenue, gross margin, and ROI with a bar graph.
P.ID : 63071
    672 views
    93 Downloads
    Get Custom Slides by Experts
    Instantly Access Templates in PowerPoint

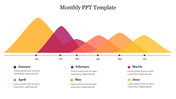
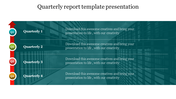
    Informative Bar Graph Inserted Template

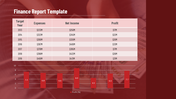
    Give a vivid explanation using the presentation template, adding more value to your presentation slides. You can find this template informative with the crystal clear bar graph and icons presented in them. There is a variety of colors used on the template to make your work attractive. You can find the four nodes provided for you with relatable content and the bar diagram representation, which makes your explanation process more elaborate. This whole template is filled with features that are highly innovative and outstanding. So, get this presentation template now.

    Features Of This Template:

    • 100% customizable slides and easy to download
    • Slides are available in different nodes & colors.
    • The slides contained 16:9 and 4:3 formats.
    • Easy to change the slide colors quickly.
    • Well-crafted template with instant download facility.
    • Crisp and elegant font style. 
    • The best template with attractive nodes.
    Advertisement

    You May Also Like These PowerPoint Templates

    Add to Wishlist
    Download
    AI Customize
    Medical icons arranged in square buttons on the left, with case report bullet points on the right in a green background.
    Add to Wishlist
    Download
    AI Customize
    Organized weekly planner with days listed in blue tabs and an illustration of two people planning.
    Add to Wishlist
    Download
    AI Customize
    Survey results show percentage breakdowns for categories with corresponding figures and brief descriptions.
    Add to Wishlist
    Download
    AI Customize
    Weekly planner template featuring a grid calendar diagram with checkmarks and a task checklist.
    Add to Wishlist
    Download
    AI Customize
    Financial report slide with key performance indicators along with additional metrics showing divident and ratio.
    Add to Wishlist
    Download
    AI Customize
    Best Infographic Survey PowerPoint Template
    Add to Wishlist
    Download
    AI Customize
    Business report template with a monthly timeline chart and three pie charts below with percentages segments.
    Add to Wishlist
    Download
    AI Customize
    Progress report slide with a circular profile image and a four row, three column table with colored bars on the right.
    Add to Wishlist
    Download
    AI Customize
    Slide featuring financial and project overviews with blue circular progress charts, and image of various graphs on the side.
    Add to Wishlist
    Download
    AI Customize
    Split layout with a multicolored pie chart showing five data percentages and a textual checklist in a blue section.
    Free
    Add to Wishlist
    Download
    AI Customize
    Weekly report layout with a goals checklist on the left and a yellow bordered table for days and columns on the right.
    Add to Wishlist
    Download
    AI Customize
    Colorful pyramid chart with five levels, each topped with a percentage and connected to icons on the right.
    Add to Wishlist
    Download
    AI Customize
    Yearly financial report slide with key figures and graphical data on shareholder returns and business line earnings.
    Add to Wishlist
    Download
    AI Customize
    A teal status report slide with a donut chart showing percentages and a table on the right detailing project phases.
    Add to Wishlist
    Download
    AI Customize
    Infographic displaying social media engagement metrics alongside a business-themed illustration.
    Add to Wishlist
    Download
    AI Customize
    Table showing monthly sales data for 2020 with targets, percentage achieved, and status using colored arrows.