Editable Report PowerPoint Presentation And Google Slides
 Canva
Canva
Report PowerPoint, Google Slides And Canva Template
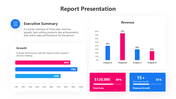
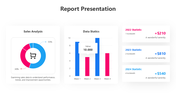
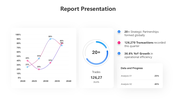
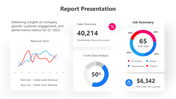
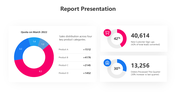
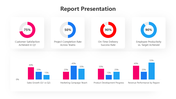
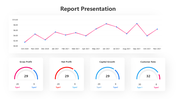
Present your data and insights with clarity and style using this multi-color themed Report presentation template. A report is a structured document or presentation that conveys data, analysis, and findings to inform, guide, or support decision-making. Designed for professionals, educators, and analysts, this template turns complex information into engaging visuals that are easy to understand. Its editable charts and graphs make it simple to highlight trends, performance metrics, and business insights in a visually appealing way. Whether it’s a corporate report, academic analysis, or project summary, this template ensures your findings stand out.
Download the Report Presentation Template now to transform your data into compelling visuals and make your insights unforgettable!
Feature of the template
- 100% customizable slides and easy to download.
- Slides are available in different nodes & colors.
- The slide is contained in 16:9 and 4:3 format.
- Easy to change the slide colors quickly.
- Well-crafted template with an instant download facility.


You May Also Like These PowerPoint Templates
Add to Wishlist
Download
AI Customize

Add to Wishlist
Download
AI Customize


Add to Wishlist
Download
AI Customize

Add to Wishlist
Download
AI Customize

Add to Wishlist
Download
AI Customize

Add to Wishlist
Download
AI Customize

Add to Wishlist
Download
AI Customize

Add to Wishlist
Download
AI Customize

Add to Wishlist
Download
AI Customize

Add to Wishlist
Download
AI Customize

Add to Wishlist
Download
AI Customize

Add to Wishlist
Download
AI Customize

Add to Wishlist
Download
AI Customize

Add to Wishlist
Download
AI Customize

Add to Wishlist
Download
AI Customize

Add to Wishlist
Download
AI Customize

Add to Wishlist
Download
AI Customize

Add to Wishlist
Download
AI Customize

Add to Wishlist
Download
AI Customize


Add to Wishlist
Download
AI Customize

Add to Wishlist
Download
AI Customize

Add to Wishlist
Download
AI Customize

Add to Wishlist
Download
AI Customize

Add to Wishlist
Download
AI Customize


Add to Wishlist
Download
AI Customize

Add to Wishlist
Download
AI Customize

Add to Wishlist
Download
AI Customize

Add to Wishlist
Download
AI Customize


Add to Wishlist
Download
AI Customize


Add to Wishlist
Download
AI Customize
