Affordable Sales Report PowerPoint Template & Google Slides

Sales report template featuring a table with rows for each month and columns for targets, profits, and status.
P.ID : 34108
    557 views
    20 Downloads
    Get Custom Slides by Experts
    Instantly Access Templates in PowerPoint

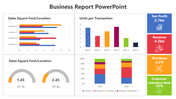
    Easy to Use Sales Report Presentation Template


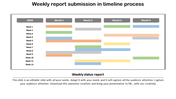
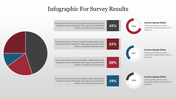
    Our Sales Report PowerPoint Template provides a clear visualization of your sales trajectory, allowing you to share essential insights and trends with your audience. This template integrates charts, graphs, and visuals seamlessly, enabling you to engage stakeholders effectively and derive actionable insights from your data. With customizable elements and a user-friendly interface, you can tailor the presentation to your specific needs, making complex data easy to understand and compelling to explore. Elevate your sales reporting capabilities and empower your team to make informed decisions with our Sales Report PowerPoint Template.

    Feature of the template

    • 100% customizable slides and easy to download.
    • Slides are available in different nodes & colors.
    • The slide is contained in 16:9 and 4:3 format.
    • Easy to change the slide colors quickly.
    • Well-crafted template with an instant download facility. 
    Advertisement

    You May Also Like These PowerPoint Templates

    Free
    Add to Wishlist
    Download
    AI Customize
    Annual report slide with a timeline for 2017 to 2019, featuring speech bubbles in gray, pink, and blue, showing percentages.
    Add to Wishlist
    Download
    AI Customize
    Financial report template with slides covering company statements,  analysis, supervisory board reports, and team profiles.
    Add to Wishlist
    Download
    AI Customize
    Company annual report slide with a gray and red graph displaying data with percentage values for investment and profit.
    Free
    Add to Wishlist
    Download
    AI Customize
    Annual report slide displaying a sales bar chart, an rate donut chart, anrevenue line graph, and an growth bar chart.
    Add to Wishlist
    Download
    AI Customize
    Slide with a revenue chart and metrics for daily, weekly, and yearly sales, along with three user graphs.
    Add to Wishlist
    Download
    AI Customize
    Annual report timeline infographic showing five speech bubbles with percentages 40%, 50%, 55%, 60%, 70% from 2015 to 2019.
    Add to Wishlist
    Download
    AI Customize
    Company Annual Report slide featuring sales data, revenue graphs, and gross profit analysis for 20XX.
    Add to Wishlist
    Download
    AI Customize
    Our Predesigned Business Report PowerPoint Template
    Add to Wishlist
    Download
    AI Customize
    Company annual report presentation template with a red, white, and black theme, featuring multiple slides.
    Add to Wishlist
    Download
    AI Customize
    Progress Report Presentation Template and Google Slides
    Add to Wishlist
    Download
    AI Customize
    Annual report slide featuring a colorful fan shaped graphic numbered 01 to 05, and text highlighting financial elements.
    Add to Wishlist
    Download
    AI Customize
    Annual report presentation slides on company strategy, growth, core values, and key facts with icons.
    Free
    Add to Wishlist
    Download
    AI Customize
    Sales performance presentation with six blue circles, each containing an icon and caption.
    Add to Wishlist
    Download
    AI Customize
    Best Business Report Infographics PowerPoint Presentation
    Add to Wishlist
    Download
    AI Customize
    Four people seated in a circle using devices, with captions in colored boxes of pink, green, teal, and yellow.
    Add to Wishlist
    Download
    AI Customize
    Business report slide featuring a laptop displaying an analytics dashboard, a smartphone on the desk, and a pink section.
    Add to Wishlist
    Download
    AI Customize
    Colorful timeline with year labels from 2012 to 2020, connected by a curved line and two circular captons below.
    Free
    Add to Wishlist
    Download
    AI Customize
    Four 3D bar columns in brown, orange, red, and gray with paint icons above and percentage labels, alongside text sections.