Free - A One Noded Annual Report PowerPoint Template Presentation

Free
Graphic displaying annual report sheets, a colorful bar chart, green blocks and a pink magnifying glass.
P.ID : 31087
    715 views
    155 Downloads
    Get Custom Slides by Experts
    Instantly Access Templates in PowerPoint

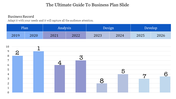
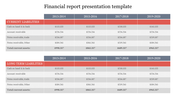
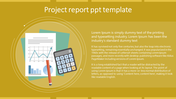
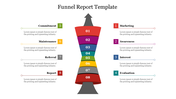
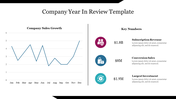
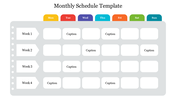
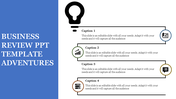
    Annual Report PPT Templates and Google Slides

    Step into the world of professional reporting with our Annual Report PowerPoint templates! Whether you're a student preparing a school project or a professional in a company, our templates will help you create impressive annual reports with ease. With our templates, you can present key statistics, communicate business strategies, and share insights clearly and concisely. Get ready to impress your audience with polished reports that leave a lasting impact. Download our Annual Report PowerPoint templates now and take your presentations to the next level!

    Features of the template 

    • 100% customizable slides and easy to download. 
    • Slides are available in different nodes & colors. 
    • The slide contains 16:9 and 4:3 formats. 
    • Easy to change the colors of the slides quickly. 
    • Well-crafted template with an instant download facility. 
    • Highly compatible with PowerPoint and Google Slides. 
    Advertisement

    You May Also Like These PowerPoint Templates

    Add to Wishlist
    Download
    AI Customize
    Weekly planner table with colorful bars indicating tasks for each month from January to June with placeholder text.
    Add to Wishlist
    Download
    AI Customize
    Timeline of weekly project report submissions across four months, using color-coded bars to different report durations.
    Add to Wishlist
    Download
    AI Customize
    An infographic slide showing survey results with a pie chart and percentages for 2016, 2017, and 2018, each with icons.
    Add to Wishlist
    Download
    AI Customize
    Report PowerPoint template showing a workspace with a laptop, clipboard, and stationery on a geometric patterned background.
    Add to Wishlist
    Download
    AI Customize
    Business report PPT with bar and pie charts including sales by location, units per transaction, and customer retention rate.
    Add to Wishlist
    Download
    AI Customize
    Status report table with five phases, colored lines connecting points, and text rows on a gray and white grid background.
    Add to Wishlist
    Download
    AI Customize
    Colorful weekly schedule PowerPoint slide with time slots for each day of the week.
    Add to Wishlist
    Download
    AI Customize
    Slide with a revenue chart and metrics for daily, weekly, and yearly sales, along with three user graphs.
    Add to Wishlist
    Download
    AI Customize
    Progress Report Presentation Template and Google Slides
    Add to Wishlist
    Download
    AI Customize
    Four people seated in a circle using devices, with captions in colored boxes of pink, green, teal, and yellow.
    Free
    Add to Wishlist
    Download
    AI Customize
    Four 3D bar columns in brown, orange, red, and gray with paint icons above and percentage labels, alongside text sections.
    Add to Wishlist
    Download
    AI Customize
    The slide features a colorful donut chart, a table with captions and checkmarks, and a bar graph with a title text area.
    Add to Wishlist
    Download
    AI Customize
    A pack of QBR meaning slides with various colorful layout designs and icons with text descriptions.
    Add to Wishlist
    Download
    AI Customize
    Monthly business review slide showing project names, dates, budgets, and rates in a tabular format with a financial overview.
    Add to Wishlist
    Download
    AI Customize
    Colorful quarterly business review slide showcasing four steps with captions and icons.
    Free
    Add to Wishlist
    Download
    AI Customize
    Project report slide with colorful bar charts showing project progress and team capacity, including RAG status indicators.
    Add to Wishlist
    Download
    AI Customize
    Pack of slides featuring various layouts containing colorful bars indicating metrics on weekly report.