Free - Innovative Sales Report Template With six Noded Model

Free
Sales report template featuring a computer monitor in brown and six captions with icons for products.
P.ID : 22043
    379 views
    81 Downloads
    Get Custom Slides by Experts
    Instantly Access Templates in PowerPoint

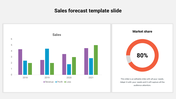
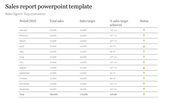
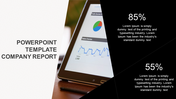
    Creative Free Sales Report PowerPoint Template

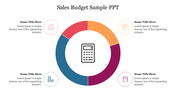
    Sales reports are a primary tool to track sales operations and whether you are reaching your targets. Do you want to share your report or ideas about sales? Then get our Free Sales Report Template. The PowerPoint consists of a monitor and six icons. Each icon represents the product so that you can discuss and track sales revenue. The layout has an orange theme to contrast and grab the audience's attention. The titles and texts are clear and understandable. You can also edit the icon and theme to fit your idea.

    Features of this template:

    • 100 % customizable slides and easy to download.
    • Slides are available in different nodes & colors.
    • The PowerPoint has six nodes.
    • The slide contained 16:9 and 4:3 formats.
    • It comes with an orange theme.
    • Easy to change the slide colors quickly.
    • It is a well-crafted template with an instant download facility.
    • It is designed with a stunning theme design.
    Advertisement

    You May Also Like These PowerPoint Templates

    Add to Wishlist
    Download
    AI Customize
    Sample sales report featuring three pie charts and a calendar table with colored bars across different months.
    Free
    Add to Wishlist
    Download
    AI Customize
    Sales performance review template with five pentagon sections from governance to field sales each with caption area.
    Free
    Add to Wishlist
    Download
    AI Customize
    Slide design for sales performance, with six circular icons in a circular pattern, each labeled with captions areas.
    Add to Wishlist
    Download
    AI Customize
    Sales report slide featuring a multicolored area chart from 2016 to 2020 with product data on the side.
    Add to Wishlist
    Download
    AI Customize
    Graphical representation of annual sales data, with emphasis on financial growth percentages and highlighted bars.
    Free
    Add to Wishlist
    Download
    AI Customize
    Red outlined pentagons labeled from 01 to 05, arranged in a circle, each containing a category for sales performance review.
    Add to Wishlist
    Download
    AI Customize
    A sales performance review template using a colorful funnel design with four sections and corresponding icons with text area.
    Free
    Add to Wishlist
    Download
    AI Customize
    Flat style product sales template with a green monitor displaying analytics, with six fashion item icons arranged around it.
    Add to Wishlist
    Download
    AI Customize
    Informative Sales Report Presentation PPT Slide Themes
    Add to Wishlist
    Download
    AI Customize
    Slide with four key metrics on sales, followed by bar, line and pie charts in yellow colored theme.
    Add to Wishlist
    Download
    AI Customize
    Nine Node Sales Report PPT Slide
    Add to Wishlist
    Download
    AI Customize
    Sales report PPT slide showing bar graphs with sales data for desktop, mobile, and tablet devices with placeholder text.
    Add to Wishlist
    Download
    AI Customize
    A colorful sales presentation layout with monthly sales figures and a calendar for March 2022, including daily sales data.
    Add to Wishlist
    Download
    AI Customize
    Get Business Sales Report Template Themes Presentation
    Add to Wishlist
    Download
    AI Customize
    Sales report line graph with markers at 2011 to 2016, indicating percentage growth milestones along a steady upward trend.
    Add to Wishlist
    Download
    AI Customize
    Effective Sales Presentation Outline Presentation Slide
    Add to Wishlist
    Download
    AI Customize
    Sales report PowerPoint slide with bar charts depicting sales, cost, profit, and cash flow over two years.
    Add to Wishlist
    Download
    AI Customize
    Sales report infographic slide comparing male and female sales figures for mobile devices and desktop computers.
    Add to Wishlist
    Download
    AI Customize
    Bar chart slide illustrating sales turnover report across six violet categories, showcasing varying levels of turnover.
    Add to Wishlist
    Download
    AI Customize
    Comparison of total sales revenue slide for USA, chile, and austria, featuring a bar chart and a world map with percentages.