Sales Turnover Report PPT Slide Column Chart
Nodes

Colors



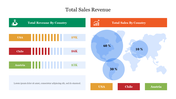
Purple Sales Turnover PPT Template
The sales turnover report ppt slide is a fantastic template that is exclusively used for sales turnover. The template is indeed a hike and eye-catchy template that can surely gain the audience's attention.
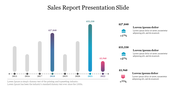
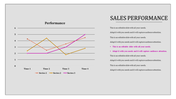
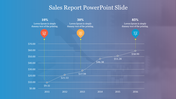
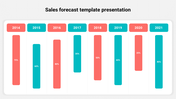
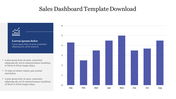
The template is fully customized and easy to edit. What makes this template so special is that the template is given in purple nodes, which are 6 in number. The nodes are designed in a bar graph design showing your business sale report in a single template.
The template is fully customized, and so you can make the changes in the graph to show your business turnover and sales of the year. So make sure that you can use this user-friendly template and gain the attention of the audience.
This template can give you 100% satisfaction with a successful presentation. Try now and download now. Give the best slide for your investors and viewers.
Features of this slide:
1. 100% customizable slides and easy to download.
2. Slides available in different nodes & colors.
3. The slide contained 16:9 and 4:3 format.
4. Easy to change the slide colors quickly.
5. Well-crafted template with instant download facility.
6. purple-colored nodes and are easy to edit.
More Collections for Sales Turnover Report PPT Slide Column Chart
Recommended based on this template.
Similar Templates to Sales Turnover Report PPT Slide Column Chart


Showing20 of69,218 templates