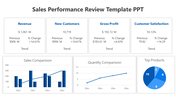
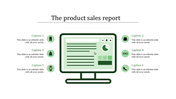
Sales Budget Sample PPT With Pie Chart Diagram Slide

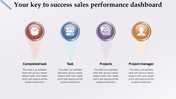

Four Noded Sales Budget PowerPoint Slide
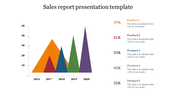
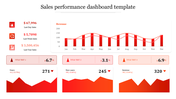
Trying to present your sales budget to your target audience? Download this Sales Budget Sample PPT Template from SlideEgg! It is an excellent tool for presenting the sales report and budget. It is a fully editable presentation template that will permit the users to modify the nodes, font, background, etc. Hurry to grab!
About the template
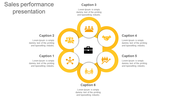
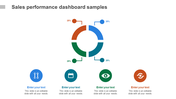
The Sales Budget PPT Template has a well-designed pie chart with four pies. Each pie has a text block to present the budget report. It includes circles with editable icons. It has captivating colors to make your presentation more interesting and attractive. Using this eye-catching slide, you can easily make professional-looking presentations. Find more Sales Report PPT templates from SlideEgg!
Features of the template
- 100% customizable slides and easy to download.
- Slides are available in different nodes & colors.
- The slide contained 16:9 and 4:3 formats.
- Easy to change the slide colors quickly.
- Well-crafted template with instant download facility.
- It has a colorful pie chart to present the sales budget.


You May Also Like These PowerPoint Templates
Add to Wishlist
Download
AI Customize

Add to Wishlist
Download
AI Customize

Free
Add to Wishlist
Download
AI Customize

Add to Wishlist
Download
AI Customize

Add to Wishlist
Download
AI Customize

Add to Wishlist
Download
AI Customize


Add to Wishlist
Download
AI Customize

Add to Wishlist
Download
AI Customize

Add to Wishlist
Download
AI Customize

Add to Wishlist
Download
AI Customize


Add to Wishlist
Download
AI Customize

Add to Wishlist
Download
AI Customize

Add to Wishlist
Download
AI Customize

Add to Wishlist
Download
AI Customize

Add to Wishlist
Download
AI Customize

Add to Wishlist
Download
AI Customize

Add to Wishlist
Download
AI Customize

Add to Wishlist
Download
AI Customize
