Sales forecast template presentation for company

Bar chart showing sales performance from 2014 to 2021 with red and blue vertical bars indicating different percentages.
P.ID : 53448
    767 views
    57 Downloads
    Get Custom Slides by Experts
    Instantly Access Templates in PowerPoint

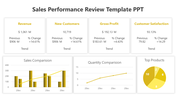
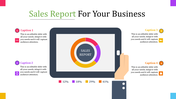
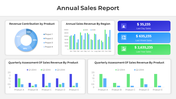
    Sales Forecast Presentation Slide

    The sales forecast template allows you to track your progress and make informed decisions that can help you stay on track towards achieving your sales targets. By identifying areas of growth and potential opportunities, you'll be able to take proactive steps to improve your sales and boost your bottom line. As small business owners and sales managers are constantly seeking ways to improve their operations and reach new heights of success, our sales forecast template is designed to be user-friendly and easily customizable to fit your unique needs. Whether you're a small business owner or a sales manager, our template can help you take your business to the next level.


    Features of the template

    • 100% customizable slides and easy to download.
    • Slides are available in different nodes & colors.
    • The slide contains 16:9 and 4:3 formats.
    • Easy to change the colors of the slide quickly.
    • Well-crafted template with an instant download facility.
    • Highly compatible with PowerPoint and Google Slides.
    • Huge Collections of slides to impress your audience.
    • It is a pre-built design to save time.
    Advertisement

    You May Also Like These PowerPoint Templates

    Add to Wishlist
    Download
    AI Customize
    Comparison of total sales revenue slide for USA, chile, and austria, featuring a bar chart and a world map with percentages.
    Add to Wishlist
    Download
    AI Customize
    Sales Budget Sample PPT With Pie Chart Diagram Slide
    Add to Wishlist
    Download
    AI Customize
    Colorful bar chart representing sales trends from 2018 to 2021, alongside a donut chart showing 80% market share.
    Add to Wishlist
    Download
    AI Customize
    3D sales chart displaying a 60 percent sales progress with an informative text section and interactive button on blue theme.
    Add to Wishlist
    Download
    AI Customize
    Bar chart showing sales performance from 2014 to 2021 with red and blue vertical bars indicating different percentages.
    Add to Wishlist
    Download
    AI Customize
    Sales turnover report slide with three icons in diamond shapes on the left and three numbered placeholders text areas.
    Add to Wishlist
    Download
    AI Customize
    Sales report slide showing metrics like sales volume, profit margin, and a gauge chart along with a bar graph.
    Add to Wishlist
    Download
    AI Customize
    Sales report slide with key metrics and multiple charts illustrating from monthly trends to quote status.
    Add to Wishlist
    Download
    AI Customize
    Sales Report PowerPoint Template and Google Slides
    Add to Wishlist
    Download
    AI Customize
    Sample sales report featuring three pie charts and a calendar table with colored bars across different months.
    Free
    Add to Wishlist
    Download
    AI Customize
    Sales performance review template with five pentagon sections from governance to field sales each with caption area.
    Free
    Add to Wishlist
    Download
    AI Customize
    Slide design for sales performance, with six circular icons in a circular pattern, each labeled with captions areas.
    Add to Wishlist
    Download
    AI Customize
    Sales performance review slide with key metrics such as revenue, new customers, gross profit, and customer satisfaction.
    Free
    Add to Wishlist
    Download
    AI Customize
    Four vertical pointed icons in red, blue, purple, and orange, each aligned with caption on a light background.
    Add to Wishlist
    Download
    AI Customize
    Sales report slide featuring a multicolored area chart from 2016 to 2020 with product data on the side.
    Add to Wishlist
    Download
    AI Customize
    Sales performance dashboard template in red displaying revenue, recent sales, user data, and session metrics visually.
    Add to Wishlist
    Download
    AI Customize
    Graphical representation of annual sales data, with emphasis on financial growth percentages and highlighted bars.
    Free
    Add to Wishlist
    Download
    AI Customize
    Sales performance chart with a central briefcase featuring interconnected yellow circles with icons and captions areas.
    Free
    Add to Wishlist
    Download
    AI Customize
    Sales performance review slide with four bullet points on the left and a line chart showing growth on the right.
    Free
    Add to Wishlist
    Download
    AI Customize
    Red outlined pentagons labeled from 01 to 05, arranged in a circle, each containing a category for sales performance review.