Status Report PowerPoint And Google Slides Template

A teal status report slide with a donut chart showing percentages and a table on the right detailing project phases.
P.ID : 69908
    1.1K+ views
    142 Downloads
    Get Custom Slides by Experts
    Instantly Access Templates in PowerPoint

    Editable Status Report PPT Template

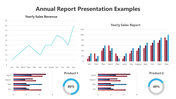
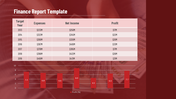
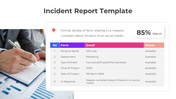
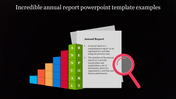
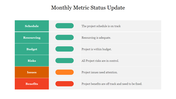
    Are you working on a brand-new project and need a report template to assist you to stay on top of all its stages? The status report PowerPoint presentation usually includes visual aids such as charts, graphs, and images to help convey the information effectively. The report may also include tables, timelines, and other data to provide a detailed picture of the project's progress. It helps to provide the project progress and status clearly and concisely. Follow us for more impressive templates.

    Features of the template

    • 100% customizable slides and easy to download.
    • Slides are available in different nodes & colors.
    • The slide contains 16:9 and 4:3 formats.
    • Easy to change the colors of the slide quickly.
    • Well-crafted template with an instant download facility.
    • Create feature-rich slide presentations.
    • Business design.
    • This slide is compatible with PPT and google slides.
    Advertisement

    You May Also Like These PowerPoint Templates

    Add to Wishlist
    Download
    AI Customize
    Quarterly report slide with a vertical red arrow marking Q1 to Q4 in colorful circles and text rows on a teal background.
    Add to Wishlist
    Download
    AI Customize
    Six-step supply chain process with hexagonal segments connected by a timeline, from raw materials to purchase.
    Add to Wishlist
    Download
    AI Customize
    Project status report template with a timeline graph from 2016 to 2025 and colored bars indicating monthly progress.
    Add to Wishlist
    Download
    AI Customize
    Medical icons arranged in square buttons on the left, with case report bullet points on the right in a green background.
    Add to Wishlist
    Download
    AI Customize
    Organized weekly planner with days listed in blue tabs and an illustration of two people planning.
    Add to Wishlist
    Download
    AI Customize
    Annual report slide featuring a financial summary with categories, budget, expenses, and net earnings in a table format.
    Add to Wishlist
    Download
    AI Customize
    Survey results show percentage breakdowns for categories with corresponding figures and brief descriptions.
    Add to Wishlist
    Download
    AI Customize
    Annual report template featuring financial metrics, performance comparisons, and graphical data visualizations.
    Add to Wishlist
    Download
    AI Customize
    Financial report slide with key performance indicators along with additional metrics showing divident and ratio.
    Add to Wishlist
    Download
    AI Customize
    Annual report slide with five sections of pie chart, bar graphs, and profit figures, in green and blue tones.
    Add to Wishlist
    Download
    AI Customize
    Slide featuring a central monochrome document icon with captions, surrounded by four images showcasing data analysis scenes.
    Add to Wishlist
    Download
    AI Customize
    Best Infographic Survey PowerPoint Template
    Add to Wishlist
    Download
    AI Customize
    Business report template with a monthly timeline chart and three pie charts below with percentages segments.
    Add to Wishlist
    Download
    AI Customize
    Progress report slide with a circular profile image and a four row, three column table with colored bars on the right.
    Add to Wishlist
    Download
    AI Customize
    Slide featuring financial and project overviews with blue circular progress charts, and image of various graphs on the side.
    Add to Wishlist
    Download
    AI Customize
    Split layout with a multicolored pie chart showing five data percentages and a textual checklist in a blue section.
    Free
    Add to Wishlist
    Download
    AI Customize
    Weekly report layout with a goals checklist on the left and a yellow bordered table for days and columns on the right.