Amazing Survey Infographic Presentation Template

 Canva
Canva

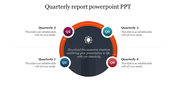
Best Survey Infographic For PowerPoint Presentation
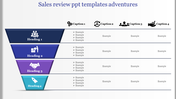
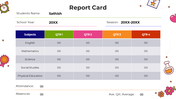
Do share your survey result with this well-designed Survey Infographic Presentation template. You can use it for all kinds of surveys, from political election surveys to company leader selection surveys. The infographic survey templates are best to share the election reports attractively to the audiences.
About this template
The Survey Infographic Presentation template is a well-crafted template. In addition, it holds a creative infographic design that is easy to understand and easy to follow. This is a three noded template, and it is pre-designed. However, infographic PPT templates are perfect for any presentation, including surveys, data-driven presentations, and statistical analyses.
Feature of this template
- The Slides are available in different nodes & colors.
- This slide contains 16:9 and 4:3 format.
- It is easy to change the slide colors quickly.
- It is a well-crafted template with an instant download facility.
- The best PowerPoint theme template.
- It is a well-designed presentation template.


You May Also Like These PowerPoint Templates
Add to Wishlist
Download
AI Customize

Add to Wishlist
Download
AI Customize

Add to Wishlist
Download
AI Customize

Add to Wishlist
Download
AI Customize

Add to Wishlist
Download
AI Customize

Add to Wishlist
Download
AI Customize


Add to Wishlist
Download
AI Customize

Add to Wishlist
Download
AI Customize

Add to Wishlist
Download
AI Customize

Add to Wishlist
Download
AI Customize

Add to Wishlist
Download
AI Customize

Add to Wishlist
Download
AI Customize

Add to Wishlist
Download
AI Customize


Add to Wishlist
Download
AI Customize

Add to Wishlist
Download
AI Customize

Add to Wishlist
Download
AI Customize

Add to Wishlist
Download
AI Customize

Add to Wishlist
Download
AI Customize
