Marketing Sales Report Presentation PowerPoint Templates

Sales report slide featuring bar charts and data on leads, web users, and program performance for the current month and day.
P.ID : 34114
    1.1K+ views
    66 Downloads
    Get Custom Slides by Experts
    Instantly Access Templates in PowerPoint

    Neat Sales Report Template

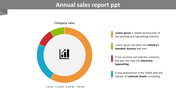
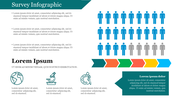
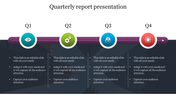
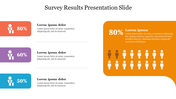
    Product sales are determined through the marketing tactics used for the promotion. The marketing is done with proper report calculation through a different process. So you can report this in this template provided by us. The five-node template is impressive, with various reporting channels with percentage levels to accurately determine the product's value. This makes the explanation easier for the presenter. Download this unique template and gain the effect. 

    Features of the template 

    • 100% customizable slides and easy to download.
    • Slides are available in different nodes & colors.
    • The slide contains 16:9 and 4:3 formats.
    • Easy to change the colors of the slide quickly.
    • Well-crafted template with instant download facility.
    • Five nodes with text area. 
    Advertisement

    You May Also Like These PowerPoint Templates

    Add to Wishlist
    Download
    AI Customize
    Slide featuring a central monochrome document icon with captions, surrounded by four images showcasing data analysis scenes.
    Add to Wishlist
    Download
    AI Customize
    Best Infographic Survey PowerPoint Template
    Add to Wishlist
    Download
    AI Customize
    Business report template with a monthly timeline chart and three pie charts below with percentages segments.
    Add to Wishlist
    Download
    AI Customize
    Progress report slide with a circular profile image and a four row, three column table with colored bars on the right.
    Add to Wishlist
    Download
    AI Customize
    Slide featuring financial and project overviews with blue circular progress charts, and image of various graphs on the side.
    Add to Wishlist
    Download
    AI Customize
    Split layout with a multicolored pie chart showing five data percentages and a textual checklist in a blue section.
    Free
    Add to Wishlist
    Download
    AI Customize
    Weekly report layout with a goals checklist on the left and a yellow bordered table for days and columns on the right.
    Add to Wishlist
    Download
    AI Customize
    Charts and graphs displaying total sales, revenue, and lead sources in an annual report presentation slide.
    Add to Wishlist
    Download
    AI Customize
    Colorful pyramid chart with five levels, each topped with a percentage and connected to icons on the right.
    Add to Wishlist
    Download
    AI Customize
    Yearly financial report slide with key figures and graphical data on shareholder returns and business line earnings.
    Add to Wishlist
    Download
    AI Customize
    A teal status report slide with a donut chart showing percentages and a table on the right detailing project phases.
    Add to Wishlist
    Download
    AI Customize
    Infographic displaying social media engagement metrics alongside a business-themed illustration.
    Add to Wishlist
    Download
    AI Customize
    Table showing monthly sales data for 2020 with targets, percentage achieved, and status using colored arrows.
    Add to Wishlist
    Download
    AI Customize
    Eye-catching Red PowerPoint Design Slide Templates