Grab striking Survey Results Presentation Slide PPT

Survey results show percentage breakdowns for categories with corresponding figures and brief descriptions.
P.ID : 56559
    1K+ views
    125 Downloads
    Get Custom Slides by Experts
    Instantly Access Templates in PowerPoint

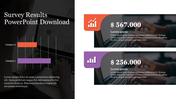
    Colorful Three Node Survey Results Slide

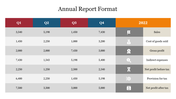
    Project your survey results clean and transparent with our templates. Fantastic ideas and graphics with new striking designs. Easy to add up your data with brief text within a wink. Customize this as you need it freely to personalize your outstanding views. You can compare the data you got from your survey, and you will also directly get the percentage amount in this. Distinctive phrases are given to provide survey details more clearly. You can highlight your results separately from the overall data. With that, you can share your sentences. Multiple colors used here are changeable. You can save more time by downloading this slide.

    Features of this template:

    • Innovative slide background designs
    • 100% easy to edit and customize slides
    • The slide contained 16:9 and 4:3 format.
    • Easy to change the slide colors quickly.
    • The elegant look of this template will give life to your process presentation.
    • Chat box graphics here to add results boldly.
    Advertisement

    You May Also Like These PowerPoint Templates

    Add to Wishlist
    Download
    AI Customize
    Annual report chart showing income percentages for four categories, with accompanying text for a quarter expansion.
    Add to Wishlist
    Download
    AI Customize
    3D bar chart company report featuring cone-shaped data points for January, February, and March under four categories.
    Add to Wishlist
    Download
    AI Customize
    3D triangular bar chart in yellow, orange, and blue shades showing monthly data for four categories, on a dark background.
    Add to Wishlist
    Download
    AI Customize
    Infographic with bar graphs in red, purple, yellow, and orange emerging from a smartphone, representing monetary values.
    Add to Wishlist
    Download
    AI Customize
    A weekly report layout with colored headers for each day of the week and space for tasks.
    Free
    Add to Wishlist
    Download
    AI Customize
    Flat style product sales template with a purple monitor displaying analytics, with six fashion item icons arranged around it.
    Free
    Add to Wishlist
    Download
    AI Customize
    Sales strategy slide with a donut chart divided into six colorful segments for acquisition sources and labeled percentages.
    Add to Wishlist
    Download
    AI Customize
    Four colorful diamond shaped icons in blue, orange, green, and purple, arranged horizontally on a white background.
    Add to Wishlist
    Download
    AI Customize
    3D pie chart in gradient shades, with six labeled sections representing various company expense categories.
    Add to Wishlist
    Download
    AI Customize
    Attractive Weekly Planner Template for Presentation
    Add to Wishlist
    Download
    AI Customize
    Sales report PPT template featuring a computer screen with data, charts, and colorful icons.
    Free
    Add to Wishlist
    Download
    AI Customize
    An annual sales template with sections labeled Heading 1 to 5 and a pie chart illustrating various percentages with text.
    Add to Wishlist
    Download
    AI Customize
    Bar chart with blue, green, and yellow bars on the left, three circular icons with captions on the right.
    Free
    Add to Wishlist
    Download
    AI Customize
    Business plan slide showing a bar chart with eight columns, featuring labeled years from 2019 to 2026, in blue tones.
    Add to Wishlist
    Download
    AI Customize
    Stacked bar chart showing monthly data with red, green, and blue segments, labeled January to December.
    Add to Wishlist
    Download
    AI Customize
    Annual report presentation slide with a modern office interior and company name and address highlighted in red and white.
    Add to Wishlist
    Download
    AI Customize
    Company annual report timeline with speech bubbles displaying percentage data gray pink, blue, and purple .