Effective Business Report Sample PPT Presentation Slide

Effective Business Report Sample PPT Presentation Slide
P.ID : 63069
    403 views
    26 Downloads
    Get Custom Slides by Experts
    Instantly Access Templates in PowerPoint

    Creative Slide To Present The Business Report


    SlideEgg offers you an eye-catching slide to present your business report more professionally to your target audience. It is a sample slide that provides you all the features you need to design the best business report instantly. It is also 100% editable. Just download it and personalize it with your own information.

    About the template


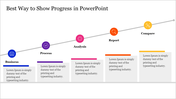
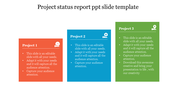
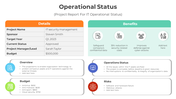
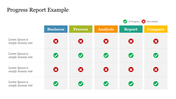
    It is a well-crafted multicolor slide with four nodes. It has four multicolor circles with icons and enough text blocks to present your notes. It allows you to present the costs and milestones. The cost table includes concept, quantity, and price. Using this report slide, you can make the best PPT presentation to convince your target audience. Find more best business PPT slides from SlideEgg!

    Features of the template

    • 100% customizable slides and easy to download.
    • Slides are available in different nodes & colors.
    • The slide contained 16:9 and 4:3 formats.
    • Easy to change the slide colors quickly.
    • Well-crafted template with instant download facility.
    • Amazing slide to present the business report.
    Advertisement

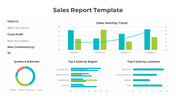
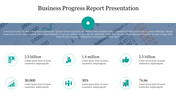
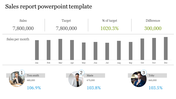
    You May Also Like These PowerPoint Templates

    Add to Wishlist
    Download
    AI Customize
    Survey results with five percentage figures from 30% to 80% above semi-circles and user icons for presentation download.
    Add to Wishlist
    Download
    AI Customize
    A treasurer’s annual report slide featuring a bar chart and line graph in purple and blue with the title.
    Add to Wishlist
    Download
    AI Customize
    Structured week-in-review slide with sections for project name, milestones, and key risks in colored boxes.
    Add to Wishlist
    Download
    AI Customize
    Weekly planner slide with five vertical columns, in green, orange, pink, purple, and blue, labeled Monday to Friday.
    Add to Wishlist
    Download
    AI Customize
    Annual report presentation showing sales revenue graph, yearly sales report, and product performance comparison.
    Add to Wishlist
    Download
    AI Customize
    Finance report slide displaying a table of expenses, net income, and profit from 2013 to 2019, with a bar chart below.
    Free
    Add to Wishlist
    Download
    AI Customize
    Graphic displaying annual report sheets, a colorful bar chart, green blocks and a pink magnifying glass.
    Add to Wishlist
    Download
    AI Customize
    Horizontal table with metric labels in colorful blocks on the left and status bars with descriptions on the right.
    Add to Wishlist
    Download
    AI Customize
    Quarterly report slide with a vertical red arrow marking Q1 to Q4 in colorful circles and text rows on a teal background.
    Add to Wishlist
    Download
    AI Customize
    Six-step supply chain process with hexagonal segments connected by a timeline, from raw materials to purchase.
    Add to Wishlist
    Download
    AI Customize
    Medical icons arranged in square buttons on the left, with case report bullet points on the right in a green background.
    Add to Wishlist
    Download
    AI Customize
    Organized weekly planner with days listed in blue tabs and an illustration of two people planning.
    Add to Wishlist
    Download
    AI Customize
    Annual report slide featuring a financial summary with categories, budget, expenses, and net earnings in a table format.
    Add to Wishlist
    Download
    AI Customize
    Survey results show percentage breakdowns for categories with corresponding figures and brief descriptions.
    Add to Wishlist
    Download
    AI Customize
    Annual report template featuring financial metrics, performance comparisons, and graphical data visualizations.
    Add to Wishlist
    Download
    AI Customize
    Slide featuring a central monochrome document icon with captions, surrounded by four images showcasing data analysis scenes.
    Add to Wishlist
    Download
    AI Customize
    Best Infographic Survey PowerPoint Template
    Add to Wishlist
    Download
    AI Customize
    Business report template with a monthly timeline chart and three pie charts below with percentages segments.