Survey Results PPT Presentation Download Google Slides

Survey results with five percentage figures from 30% to 80% above semi-circles and user icons for presentation download.
P.ID : 56561
    929 views
    129 Downloads
    Get Custom Slides by Experts
    Instantly Access Templates in PowerPoint

    Creative Survey Results Study PPT Template 

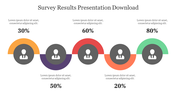
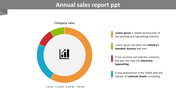
    Download our Survey Results Presentation to make excellent presentations on reports, business data analysis, Key Facts, etc. This PPT is made of brilliant circle design with a percentage level to engage the audience. It is a pre-built slide with all the essential report elements you need. About the design of the slides, It has a colorful circle shape with five icons. In addition, this Slide is 100% editable in which users can add their Survey data. In addition, you can pick any slides from our report PowerPoint category. 

    Features of this template

    • Fully Customizable (shape, color, size & text)
    • This template has a circle theme, and you can also choose the color
    • Huge Collections of Market slides to impress your audience
    • This Market slide supports 16:9 and 4:3.
    • Easily readable and acceptable template.
    Advertisement

    You May Also Like These PowerPoint Templates

    Add to Wishlist
    Download
    AI Customize
    Effective Business Report Sample PPT Presentation Slide
    Add to Wishlist
    Download
    AI Customize
    Quarterly report slide with a vertical red arrow marking Q1 to Q4 in colorful circles and text rows on a teal background.
    Add to Wishlist
    Download
    AI Customize
    Six-step supply chain process with hexagonal segments connected by a timeline, from raw materials to purchase.
    Add to Wishlist
    Download
    AI Customize
    Project status report template with a timeline graph from 2016 to 2025 and colored bars indicating monthly progress.
    Add to Wishlist
    Download
    AI Customize
    Medical icons arranged in square buttons on the left, with case report bullet points on the right in a green background.
    Add to Wishlist
    Download
    AI Customize
    Organized weekly planner with days listed in blue tabs and an illustration of two people planning.
    Add to Wishlist
    Download
    AI Customize
    Survey results show percentage breakdowns for categories with corresponding figures and brief descriptions.
    Add to Wishlist
    Download
    AI Customize
    Financial report slide with key performance indicators along with additional metrics showing divident and ratio.
    Add to Wishlist
    Download
    AI Customize
    Best Infographic Survey PowerPoint Template
    Add to Wishlist
    Download
    AI Customize
    Business report template with a monthly timeline chart and three pie charts below with percentages segments.
    Add to Wishlist
    Download
    AI Customize
    Progress report slide with a circular profile image and a four row, three column table with colored bars on the right.
    Add to Wishlist
    Download
    AI Customize
    Slide featuring financial and project overviews with blue circular progress charts, and image of various graphs on the side.
    Add to Wishlist
    Download
    AI Customize
    Split layout with a multicolored pie chart showing five data percentages and a textual checklist in a blue section.
    Free
    Add to Wishlist
    Download
    AI Customize
    Weekly report layout with a goals checklist on the left and a yellow bordered table for days and columns on the right.
    Add to Wishlist
    Download
    AI Customize
    Colorful pyramid chart with five levels, each topped with a percentage and connected to icons on the right.