Performance Management PPT Presentation & Google Slides

Woman pointing a table with eight colored boxes representing performance management, with pink bordered layout.
P.ID : 5987
    2.1K+ views
    99 Downloads
    Get Custom Slides by Experts
    Instantly Access Templates in PowerPoint

    Eight-Nodded Performance Management Template:


    Download this professionally designed and well-crafted Performance Management Presentation Slide from SlideEgg to make an excellent corporate presentation. This template can offer you a more effective way of conveying the essential data and information you need to share with your audience. 

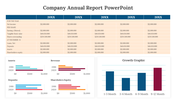
    `The Performance Management Presentation Slide is an eight-noded, multi-color template. It has a table format to present the performance analysis data. It will be very easy for your audience to understand the information presented. This template may work best to inform your audience about what they can do to improve their performance levels. Grab Now!


    Features of this template:

    • 100% customizable slides and easy to download.
    • Slides available in different nodes & colors.
    • The slide contained 16:9 and 4:3 format.
    • Easy to change the slide colors quickly.
    • Well-crafted template with instant download facility.
    • Creative images and icons are used.
    • The best multi-colored Template.
    Advertisement

    You May Also Like These PowerPoint Templates

    Add to Wishlist
    Download
    AI Customize
    Timeline of weekly project report submissions across four months, using color-coded bars to different report durations.
    Add to Wishlist
    Download
    AI Customize
    An infographic slide showing survey results with a pie chart and percentages for 2016, 2017, and 2018, each with icons.
    Add to Wishlist
    Download
    AI Customize
    Report PowerPoint template showing a workspace with a laptop, clipboard, and stationery on a geometric patterned background.
    Free
    Add to Wishlist
    Download
    AI Customize
    Annual sales template with a green pie chart, a cartoon character pointing to it, and space for headings and descriptions.
    Add to Wishlist
    Download
    AI Customize
    Business report PPT with bar and pie charts including sales by location, units per transaction, and customer retention rate.
    Add to Wishlist
    Download
    AI Customize
    Status report table with five phases, colored lines connecting points, and text rows on a gray and white grid background.
    Add to Wishlist
    Download
    AI Customize
    2019 annual report slide design with brown and orange geometric shapes and a building image in the layout.
    Add to Wishlist
    Download
    AI Customize
    Colorful weekly schedule PowerPoint slide with time slots for each day of the week.
    Free
    Add to Wishlist
    Download
    AI Customize
    Annual report slide with a timeline for 2017 to 2019, featuring speech bubbles in gray, pink, and blue, showing percentages.
    Add to Wishlist
    Download
    AI Customize
    Financial report template with slides covering company statements,  analysis, supervisory board reports, and team profiles.
    Add to Wishlist
    Download
    AI Customize
    Company annual report slide with a gray and red graph displaying data with percentage values for investment and profit.
    Free
    Add to Wishlist
    Download
    AI Customize
    Annual report slide displaying a sales bar chart, an rate donut chart, anrevenue line graph, and an growth bar chart.
    Add to Wishlist
    Download
    AI Customize
    Slide with a revenue chart and metrics for daily, weekly, and yearly sales, along with three user graphs.
    Add to Wishlist
    Download
    AI Customize
    Progress Report Presentation Template and Google Slides
    Add to Wishlist
    Download
    AI Customize
    Four people seated in a circle using devices, with captions in colored boxes of pink, green, teal, and yellow.
    Free
    Add to Wishlist
    Download
    AI Customize
    Four 3D bar columns in brown, orange, red, and gray with paint icons above and percentage labels, alongside text sections.