Best Way to Show Progress in PowerPoint and Google Slides

Progress tracking steps slide from business to compare, depicted in a linear graph with color coded icons and captions.
P.ID : 63229
    36 slides
    Slide deck on monthly report designs displayed in a grid layout, featuring charts, graphs, and diagrams in various colors.
    13 slides
    Collection of slides with four blocker report templates, using colorful hexagons, stacked blocks, and circular layouts.
    36 slides
    Business annual report infographic with various data visualization slides for financial and performance analysis.
    733 views
    107 Downloads
    Get Custom Slides by Experts
    Instantly Access Templates in PowerPoint

    Show Your Business Progress With This Creative Slide


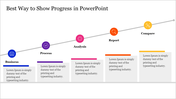
    Trying to present your business progress in an engaging manner? Download this creative slide available at SlideEgg! It is the best way to present the progress of your business. Using this slide, you can make attractive PowerPoint presentations to convey your information professionally. Using this progress slide, you can prepare your business plans for better growth. Hurry to grab!

    About the template


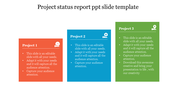
    It is a five-noded template with multicolor circles placed in a slanting line. The circles have icons representing business, process, analysis, report, and comparison. The slanting line clearly shows the growth. The white background enriches the look and feels of the colorful graphics. It also includes five text blocks to place your notes. You can also find a free Google Slide to present your business plans without breaking the bank.

    Features of the template

    • 100% customizable slides and easy to download.
    • Slides are available in different nodes & colors.
    • The slide contained 16:9 and 4:3 formats.
    • Easy to change the slide colors quickly.
    • Well-crafted template with instant download facility.
    • Creative slide to present the business growth.
    Advertisement

    You May Also Like These PowerPoint Templates

    Add to Wishlist
    Download
    AI Customize
    Annual report slide with product usage chart and table, detailing sales data, revenue, and profit margins.
    Add to Wishlist
    Download
    AI Customize
    Detailed project report slide showing a timeline for development phases, budget, schedule, benefits, and a risk issue table.
    Add to Wishlist
    Download
    AI Customize
    Sales report slide featuring bar charts and data on leads, web users, and program performance for the current month and day.
    Add to Wishlist
    Download
    AI Customize
    Marketing Report PowerPoint And Google Slides Template
    Add to Wishlist
    Download
    AI Customize
    Woman pointing a table with eight colored boxes representing performance management, with pink bordered layout.
    Add to Wishlist
    Download
    AI Customize
    Progress report table displaying different categories with green checks for in progress and red crosses with caption areas.
    Add to Wishlist
    Download
    AI Customize
    Effective Business Progress Report Presentation Template
    Add to Wishlist
    Download
    AI Customize
    Survey results with five percentage figures from 30% to 80% above semi-circles and user icons for presentation download.
    Add to Wishlist
    Download
    AI Customize
    A treasurer’s annual report slide featuring a bar chart and line graph in purple and blue with the title.
    Add to Wishlist
    Download
    AI Customize
    Structured week-in-review slide with sections for project name, milestones, and key risks in colored boxes.
    Add to Wishlist
    Download
    AI Customize
    Annual report PowerPoint template featuring financial icon, yearly revenue, and a business meeting background image.
    Add to Wishlist
    Download
    AI Customize
    Weekly planner slide with five vertical columns, in green, orange, pink, purple, and blue, labeled Monday to Friday.
    Add to Wishlist
    Download
    AI Customize
    Timing PowerPoint slide with a daily schedule table and an illustration of a person sitting next to an hourglass.
    Add to Wishlist
    Download
    AI Customize
    Annual report presentation showing sales revenue graph, yearly sales report, and product performance comparison.
    Add to Wishlist
    Download
    AI Customize
    Finance report slide displaying a table of expenses, net income, and profit from 2013 to 2019, with a bar chart below.
    Free
    Add to Wishlist
    Download
    AI Customize
    Graphic displaying annual report sheets, a colorful bar chart, green blocks and a pink magnifying glass.
    Add to Wishlist
    Download
    AI Customize
    A monthly PowerPoint template displaying colorful wave like graphs for each month from January to June with placeholder text.