Innovative Free PowerPoint Charts Templates Presentation

Line graph infographic showing data from 2015 to 2020, with three colored lines in purple, yellow, and green, and text.
P.ID : 46402
    149 views
    26 Downloads
    Get Custom Slides by Experts
    Instantly Access Templates in PowerPoint

    Submit Statistical Analysis With This Template:


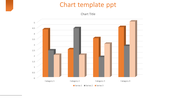
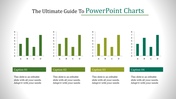
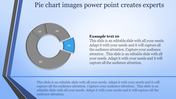
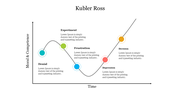
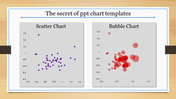
    Have a look at this free PowerPoint charts template designed for you to provide precise details about your topic. You are provided with the graph to present analytical details in your presentation. Look at the different colors used in the lines, which can be edited as per your wish anytime. 

    Also, this template is available at an affordable cost which you can use several times once after downloading it. On the x and y-axis of the graph, you can provide the numbers and captions required for your ppt. On the right side of the template describing your graph, you can give details about your graph lines. Don't miss these free charts PowerPoint, and you will regret it later. 


    Features Of this Template:

    • 100% customizable slides and easy to download.
    • Slides are available in different nodes and colors.
    • The Slide contained 16:9 and 4:3 format.
    • Easy to change the Slides colors quickly.
    • Well-crafted template with instant download facility.
    • Informative graph with colors.
    • The best template from SlideEgg. 
    Advertisement

    You May Also Like These PowerPoint Templates

    Add to Wishlist
    Download
    AI Customize
    Executive dashboard presentation slide with arrows and title placeholders on a notebook background.
    Add to Wishlist
    Download
    AI Customize
    PowerPoint pie chart template with three segments and associated icons.
    Add to Wishlist
    Download
    AI Customize
    Three vertical rectangular sections with headers in green, blue, and orange, each with captions inside.
    Add to Wishlist
    Download
    AI Customize
    Colorful pie chart PowerPoint slide with five labeled sections and captions on a white backdrop.
    Free
    Add to Wishlist
    Download
    AI Customize
    Pie chart slide with a blue and dark blue donut chart showing 75% sales, two numbered text boxes on the right.
    Add to Wishlist
    Download
    AI Customize
    Executive dashboard slide with a gauge displaying performance across different levels, labeled three sections.
    Free
    Add to Wishlist
    Download
    AI Customize
    Green and black area chart with a star shaped yellow badge and four circular icons with text below.
    Add to Wishlist
    Download
    AI Customize
    Marketing KPI template with three circular icons, and bar and line charts in blue, gray, and green below.
    Add to Wishlist
    Download
    AI Customize
    Bar chart with green hues, showing data for six categories, with side status boxes and light text.
    Free
    Add to Wishlist
    Download
    AI Customize
    Three column layout with blue megaphone, orange lightbulb, and red envelope icons on a beige background.
    Add to Wishlist
    Download
    AI Customize
    3D triangular bar chart in yellow, orange, and blue shades showing monthly data for four categories, on a dark background.
    Free
    Add to Wishlist
    Download
    AI Customize
    A simple chart slide with overlaid blue, green, orange, and yellow circles of varying sizes with a graph and captions.
    Add to Wishlist
    Download
    AI Customize
    Gantt chart PowerPoint template showing a timeline for multiple targets across January, February, and March, with milestones.
    Add to Wishlist
    Download
    AI Customize
    Bar chart slide showcasing yearly data from 2016 to 2021, with three distinct bar categories and values in shades of purple.
    Add to Wishlist
    Download
    AI Customize
    Bar chart slide with colorful conical graphs representing different categories, accompanied by labeled captions and icons.
    Add to Wishlist
    Download
    AI Customize
    3D cone chart with orange, pink, and blue segments, placed on a gray platform with a white background.
    Add to Wishlist
    Download
    AI Customize
    Bar chart slide showing the performance of four products with categories like sales growth, market share, and profit margin.