Our Predesigned Chart Templates PPT Slides Designs

Our Predesigned Chart Templates PPT Slides Designs
P.ID : 38617
    200 views
    12 Downloads
    Get Custom Slides by Experts
    Instantly Access Templates in PowerPoint

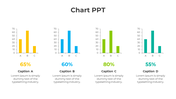
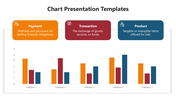
    Dynamic Chart Templates for PPT Presentations


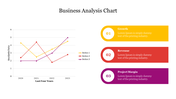
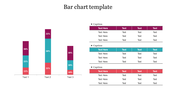
    Crafted with precision and creativity, these templates offer a seamless blend of functionality and aesthetics, making your data come to life on the screen. With four nodes strategically placed, our orange-themed bar chart graphs add a pop of color and clarity to your presentations, ensuring that your audience stays engaged and informed throughout. Whether you're analyzing trends, comparing statistics, or presenting financial data, our user-friendly templates make it easy to convey complex information with ease. Say goodbye to dull and static charts and hello to dynamic and impactful presentations that leave a lasting impression. Elevate your storytelling and captivate your audience with our versatile Chart Templates PPT Slides.


    Features of this template:

    • 100% customizable slides and easy to download.
    • Slides available in different nodes & colors.
    • The slide contained 16:9 and 4:3 format.
    • Easy to change the slide colors quickly.
    • Well-crafted template with instant download facility.
    Advertisement

    You May Also Like These PowerPoint Templates

    Add to Wishlist
    Download
    AI Customize
    Color coded KWL chart template with sections for What I Know, What I Want to Know, and What I Learned with placeholder text.
    Add to Wishlist
    Download
    AI Customize
    Pie chart slide showcasing six labeled segments in yellow and gray with surrounding icons, on a blue networked background.
    Add to Wishlist
    Download
    AI Customize
    Pie chart slide with four numbered pie charts in blue, maroon, orange, and red, each linked to a text box with labels.
    Add to Wishlist
    Download
    AI Customize
    A slide with a line chart slide showing data for Category 1 to 2 over several years with placeholder text.
    Add to Wishlist
    Download
    AI Customize
    Innovative Pie Chart Presentation Example Slide PPT
    Add to Wishlist
    Download
    AI Customize
    PowerPoint slide featuring four bar charts with different colors and captions, each representing different data percentages.
    Add to Wishlist
    Download
    AI Customize
    Scatter plot with differently sized bubbles in orange and purple, with a legend and product descriptions to the side.
    Add to Wishlist
    Download
    AI Customize
    Green color KWL chart presentation template with sections for What I Know, What I Want to Know, and What I Learned.
    Add to Wishlist
    Download
    AI Customize
    Yearly loss chart with six green bars and a line graph illustrating trends from 2014 to 2019.
    Add to Wishlist
    Download
    AI Customize
    Mekko chart displaying monthly data in sections, with colors indicating different categories from January to December.
    Add to Wishlist
    Download
    AI Customize
    KWL chart slide with three light gray boxes, featuring maroon headers and side labels for knowledge tracking.
    Add to Wishlist
    Download
    AI Customize
    KWL Chart Infographics PPT Template For Presentation
    Add to Wishlist
    Download
    AI Customize
    EDITABLE TRACTION POWERPOINT DESIGN TEMPLATES
    Free
    Add to Wishlist
    Download
    AI Customize
    Slide with a circular chart and two bars, highlighted in red, with progress indicator and explanatory text beside.
    Add to Wishlist
    Download
    AI Customize
    Pie chart on the left with four colored sections and percentages, alongside steps with matching colors on the right.
    Add to Wishlist
    Download
    AI Customize
    PowerPoint slide with multiple charts and graphs, including a line chart, bar chart, and area chart, each with captions.
    Add to Wishlist
    Download
    AI Customize
    PPT slide with a line chart illustrating trends for three series, using red, blue, and yellow lines with a caption.