Chart Presentation Template for PowerPoint and Google Slides Themes

 Canva
Canva
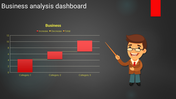
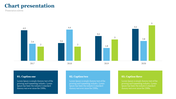
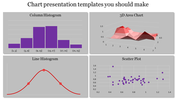
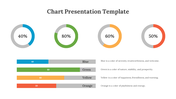
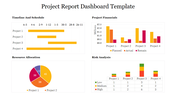
Chart Presentation Template for PowerPoint and Google Slides
Elevate your data visualization game with our Chart Presentation template, tailored for both PowerPoint and Google Slides. Featuring sleek bars in a subtle shade of grey, this template offers a sophisticated canvas for your numerical insights.
Each bar represents a data point, with the count values elegantly displayed along the y-axis. Atop the graph, ample space is reserved for crisp, informative text, ensuring your audience grasps the significance of the visual at a glance. Against a backdrop of pristine white, your charts command attention, delivering key metrics with precision and clarity.
Whether you're presenting financial data, market trends, or performance metrics, this template empowers you to convey your message with authority and impact. Download now and unlock the potential of your data-driven presentations!
Features of the template
- 100% customizable slides and easy to download.
- Slides are available in different nodes & colors.
- The slide contains 16:9 and 4:3 formats.
- It is easy to change the colors of the slide quickly.
- Well-crafted template with an instant download facility.


You May Also Like These PowerPoint Templates
Free
Add to Wishlist
Download
AI Customize


Add to Wishlist
Download
AI Customize

Add to Wishlist
Download
AI Customize

Add to Wishlist
Download
AI Customize

Add to Wishlist
Download
AI Customize

Add to Wishlist
Download
AI Customize

Add to Wishlist
Download
AI Customize


Add to Wishlist
Download
AI Customize

Add to Wishlist
Download
AI Customize


Add to Wishlist
Download
AI Customize

Add to Wishlist
Download
AI Customize

Add to Wishlist
Download
AI Customize

Free
Add to Wishlist
Download
AI Customize

Add to Wishlist
Download
AI Customize

Free
Add to Wishlist
Download
AI Customize

