Amazing Comparison Chart Template PowerPoint-Two Node


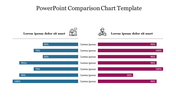
Comparison Chart PowerPoint Template
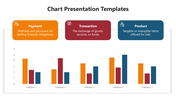
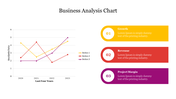
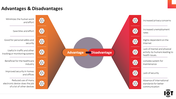
Our Comparison Chart PowerPoint Template helps you to provide better summary to the audience. The slide comes with two sections identified by distinct colors. Bars indicating numerical values can be seen in both the sections. Captions and descriptions can be customized.
Captions and brief descriptions are given with customization options. Perfect for analysts, business leaders, presenters. Suitable template for showcasing financial metrics, market trends, performance indicators. Download now to elevate your presentations effortlessly.
Features of the template
- 100% customizable slides and easy to download.
- Slides are available in different nodes & colors.
- The slide contains 16:9 and 4:3 formats.
- It is easy to change the colors of the slide quickly.
- Well-crafted template with an instant download facility.


You May Also Like These PowerPoint Templates
Add to Wishlist
Download
Edit


Add to Wishlist
Download
Edit


Add to Wishlist
Download
Edit

Add to Wishlist
Download
Edit

Add to Wishlist
Download
Edit


Add to Wishlist
Download
Edit


Add to Wishlist
Download
Edit


Add to Wishlist
Download
Edit

Add to Wishlist
Download
Edit


