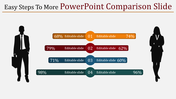
Best Infographic Comparison Chart Presentation Slide

 Canva
Canva
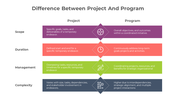
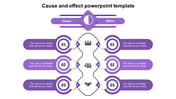
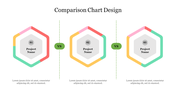
Colorful Six Noded Infographic Slide For Project Comparisons
Infographics are the best tool for visual representations. If you use infographics in your presentations, it will convey your information in a visually striking manner. SlideEgg offers you this professionally crafted slide to present the comparison of data. It is a 100% editable slide according to your needs. Hurry to grab!
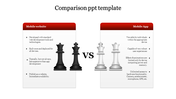
About the template
Creative circular loop infographic designs are given in this compare PPT slide to show the comparisons. Using this comparison chart in your presentation, you can make the audience easily find the comparison between the two projects. It has six multicolor nodes and enough text blocks to hold your notes. We also provide you creative rectangular shape slides to make stunning infographic presentations.
Features of the template
- 100% customizable slides and easy to download.
- Slides are available in different nodes & colors.
- The slide contained 16:9 and 4:3 formats.
- Easy to change the slide colors quickly.
- Well-crafted template with instant download facility.
- The best slide for project comparison presentations.


You May Also Like These PowerPoint Templates
Add to Wishlist
Download
Edit


Add to Wishlist
Download
Edit

Add to Wishlist
Download
Edit

Add to Wishlist
Download
Edit


Add to Wishlist
Download
Edit

Add to Wishlist
Download
Edit


Add to Wishlist
Download
Edit


Add to Wishlist
Download
Edit

Add to Wishlist
Download
Edit

Add to Wishlist
Download
Edit


Add to Wishlist
Download
Edit
