Free - Example of Cause and Effect PowerPoint Presentation

Free
Orange themed cause and effect diagram PowerPoint template with circular steps connected to a central node.
P.ID : 43832
    508 views
    176 Downloads
    Get Custom Slides by Experts
    Instantly Access Templates in PowerPoint

    Excellent Diagram of Cause and Effect

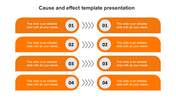
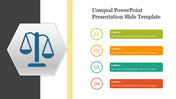
    The most critical thoughts emerge when you inquire why and when things happen. During this time, the cause and effect diagram may assist you in determining the root cause and a solution to your problem. To produce and rank ideas, use our Cause and Effect PPT Template. The PowerPoint is blood red, with hexagon text holders joined in the center regions by hexagon shapes. Each segment has three text areas, for a total of six  text areas. Each text field has a different color to attract your readers' attention. It also works with PPT and Google Slides. Try it right now.

    Features of this Template 

    • 100 % customizable slides and easy to download.
    • Slides are available in different colors.
    • The SlideSlide has 4:3 and 16:9 formats.
    • Easy to change the slide colors quickly.
    • Appealing Presentation to impress an audience.
    • Create feature-rich slide presentations. 
    • An eye-pleasing color slide helps to give a catchy presentation.
    • Crisp and clear font styles and design Presentation.
    • Consistent with Microsoft PPT and Google Slide.
    • Eye-catching hexagon display.
    Advertisement

    You May Also Like These PowerPoint Templates

    Free
    Add to Wishlist
    Download
    AI Customize
    Comparison PPT slide featuring two professional portraits of a man and a woman, accompanied by captions.
    Add to Wishlist
    Download
    AI Customize
    Side by side comparison layout with four color coded sections in blue, red, orange, and green, showing phone features.
    Free
    Add to Wishlist
    Download
    AI Customize
    Merits and demerits slide featuring a divided layout with a central circular image of a stressed person at a desk.
    Free
    Add to Wishlist
    Download
    AI Customize
    Three blue circular containers paired with numbered circles and text sections on the right, against a gray background.
    Add to Wishlist
    Download
    AI Customize
    Force field template with driving and restricting forces each with a colored box and placeholder text areas.
    Add to Wishlist
    Download
    AI Customize
    Two groups labeled teams, each surrounded by illustrated figures and two caption areas on a neutral background.
    Add to Wishlist
    Download
    AI Customize
    Blue and red comparison layout with horizontal arrows, with corresponding content bars underneath.
    Add to Wishlist
    Download
    AI Customize
    Two column comparison template for small and big data, each in blue bordered boxes, on a dark background.
    Add to Wishlist
    Download
    AI Customize
    Comparison diagram with green checkmarks on one side and red cross marks on the other, each with numbered points.
    Add to Wishlist
    Download
    AI Customize
    Slide comparing two teams, with orange and blue silhouettes and matching colored speech bubbles for caption areas.
    Add to Wishlist
    Download
    AI Customize
    Slide comparing male and female icons with six captions representing different aspects of comparison.
    Add to Wishlist
    Download
    AI Customize
    Orange and blue oval shapes on opposite sides, featuring text lists and icons for positive and negative aspects.
    Free
    Add to Wishlist
    Download
    AI Customize
    Comparison of Dell and HP laptops: Dell $199, HP 89% satisfaction, basic vs pro details.
    Add to Wishlist
    Download
    AI Customize
    Comparison slide with a balance scale graphic showing colorful numbered lists on both sides against a white background.
    Free
    Add to Wishlist
    Download
    AI Customize
    A comparison slide with a robot on the left and a human silhouette on the right, featuring caption text in the center.
    Add to Wishlist
    Download
    AI Customize
    Comparison chart with four columns in green, orange, blue, and yellow listing features like price, size, and battery life.
    Add to Wishlist
    Download
    AI Customize
    Colorful comparison infographic slides with charts, icons, and illustrations for presentations.