Dynamic Comparison PowerPoint Template for Presentations

 Canva
Canva
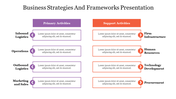
Comparison PowerPoint Template and Google Slides
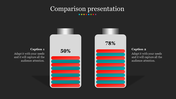
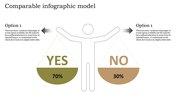
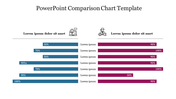
The "Comparison PowerPoint Template and Google Slides" offers a dynamic platform to illustrate and analyze contrasts between different entities or concepts. The image features two people seated at desks, each with a caption box displaying a percentage: 65% for the person on the left and 82% for the person on the right. The text at the top reads "Creative Ways You Can Improve Your Comparison."
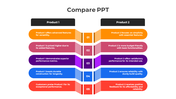
This template is ideal for presenting comparative analyses, performance evaluations, product comparisons, competitive market assessments, or any scenario where highlighting differences and similarities is crucial.
Business professionals, analysts, marketers, educators, or anyone needing to convey comparative information effectively can benefit from using this template.
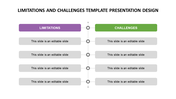
Compatible with PowerPoint and Google Slides. Available in "16:9" and "4:3" formats and zip files for easy sharing. Free and fully customizable. Download this versatile template now and elevate your message with clarity and insight!


You May Also Like These PowerPoint Templates
Free
Add to Wishlist
Download
AI Customize


Add to Wishlist
Download
AI Customize

Add to Wishlist
Download
AI Customize

Add to Wishlist
Download
AI Customize

Add to Wishlist
Download
AI Customize

Add to Wishlist
Download
AI Customize

Add to Wishlist
Download
AI Customize


Add to Wishlist
Download
AI Customize


Add to Wishlist
Download
AI Customize

Add to Wishlist
Download
AI Customize

Add to Wishlist
Download
AI Customize

Add to Wishlist
Download
AI Customize

Add to Wishlist
Download
AI Customize


Add to Wishlist
Download
AI Customize
