Incredible Unequal PowerPoint Presentation Slide Template

Hexagonal icon with a blue scales symbol on a gradient gray background, with four numbered captions in different colors.
P.ID : 53834
    673 views
    52 Downloads
    Get Custom Slides by Experts
    Instantly Access Templates in PowerPoint

    Present Elaborate Points With This Template:


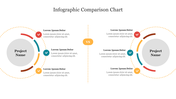
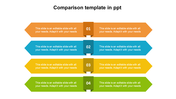
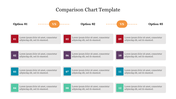
    Expand your points about unequal justice which is used in the court through this template. You can present your themes related to the topic in an elegant manner using the nodes given in this template. The diagram clearly represents your theme with its effective color and its design. You can find that this unequal PowerPoint presentation slide template is inserted with four nodes that are filled with unique colors that capture the attention of your audience without any delay. 

    You can also find that there are numbers presented beside the nodes which forms a connectivity and compares your points. This whole template is filled with many unique features that uplifts the standard of your template. So, get this unequal power point presentation slide template at the earliest from us.


    Features Of This Template:

    • 100% customizable slides and easy to download
    • Slides are available in different nodes & colors.
    • The slides contained 16:9 and 4:3 format.
    • Easy to change the slide colors quickly.
    • Well-crafted Template with instant download facility.
    • Crisp and elegant font style. 
    • The best Template with attractive nodes.
    Advertisement

    You May Also Like These PowerPoint Templates

    Add to Wishlist
    Download
    AI Customize
    Comparison slide with four rows of green and blue text boxes, connected by numbered circular segments in the center.
    Add to Wishlist
    Download
    AI Customize
    Yin and yang diagram with red and blue halves, featuring handshake and coin icons, and captions on either side.
    Add to Wishlist
    Download
    AI Customize
    Leadership Vs Management PPT Template and Google Slides
    Add to Wishlist
    Download
    AI Customize
    Internal vs external audit slide with red and teal sections for the characteristic differences between both audit types.
    Free
    Add to Wishlist
    Download
    AI Customize
    Template for superlative adjectives and adverbs, featuring a table with columns for base form, comparative, and superlative.
    Add to Wishlist
    Download
    AI Customize
    Android mobile vs. Apple mobile slides featuring logos of both platforms in different layout designs and icons with text.
    Add to Wishlist
    Download
    AI Customize
    Slide comparing two processes side by side, each with three steps, represented by numbered multi colored boxes.
    Add to Wishlist
    Download
    AI Customize
    Visual comparison of manager versus leader roles using illustrated avatars and lists of traits on a green background.
    Add to Wishlist
    Download
    AI Customize
    Visual slide for comparing two concepts with red and green arrows with placeholder text.
    Add to Wishlist
    Download
    AI Customize
    Comparison slide deck featuring different visual formats like arrows, charts, and hexagons to compare two products.
    Add to Wishlist
    Download
    AI Customize
    A slide with a comparison chart featuring two designs, each with steps and bar graphs in orange, red, blue, green and purple.
    Add to Wishlist
    Download
    AI Customize
    Two rounded rectangles in teal and red with icons and text, arranged side by side, on a white background.
    Add to Wishlist
    Download
    AI Customize
    Comparison slide featuring red and blue hexagons on either side, with seven numbered nodes connected by lines.
    Add to Wishlist
    Download
    AI Customize
    A pack of achievements and challenges slides featuring a comparison of successful outcomes with various colorful designs.
    Add to Wishlist
    Download
    AI Customize
    Force Field Analysis PowerPoint Presentation Diagram
    Add to Wishlist
    Download
    AI Customize
    Comparison slide showing a bar chart with Generation X and Generation Z percentages, along with illustrated characters.