Actual Vs Target Sale Google Slides and PowerPoint Templates

Sales performance slide showing actual vs target sales with a horizontal bar chart, highlighting differences in seven KPIs.
P.ID : 55907
    21 slides
    Comparison slide deck featuring different visual formats like arrows, charts, and hexagons to compare two products.
    11 slides
    Best Fixed Vs Growth Mindset PPT And Google Slides Templates
    10 slides
    Amazing Build Vs Buy PowerPoint And Google Slides Templates
    1.3K+ views
    129 Downloads
    Get Custom Slides by Experts
    Instantly Access Templates in PowerPoint

    Editable Actual Vs Target Sale PowerPoint Template


    Download this Editable Actual Vs. Target Sale PowerPoint Template for your marketing and business presentations. This is a proficiently well-built template. This is a 100% user-friendly template. This pre-designed template makes your presentation-creating task a hassle-free one.

    This Editable Actual Vs. Target Sale PowerPoint Template is one of the best compare templates from SlideEgg. Actual vs. Target values are used to check whether the target value has been met or not. These types of charts are used in various organizations and companies where some type of target is to be achieved.

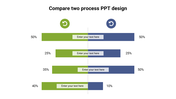
    This template has a graphical representation of the comparison. It depicts the actual and target sales comparison. They are illustrated in a bar graph with two elements.

    Use this elegant template to make your audience grab your information at their first glance. Grab now!!!


    Features of this template:

    • 100% customizable slides and easy to download.
    • Slides available in different nodes & colors.
    • The slide contained 16:9 and 4:3 format.
    • Easy to change the slide colors quickly.
    • Well-crafted template with instant download facility.
    • Premium template with exclusive features.
    Advertisement

    You May Also Like These PowerPoint Templates

    Add to Wishlist
    Download
    AI Customize
    Comparison layout with orange and red header boxes labeled with online and normal shopping, separated by a blue Vs circle.
    Add to Wishlist
    Download
    AI Customize
    Comparison slide with an orange and red vertical bar featuring a grid with gray text boxes separated by colored headers.
    Add to Wishlist
    Download
    AI Customize
    Comparison chart slide showing the differences between a leader and a supervisor, with icons and bullet points for each role.
    Add to Wishlist
    Download
    AI Customize
    A superlative slide showing three individuals, with labels from short to shortest with placeholder text.
    Add to Wishlist
    Download
    AI Customize
    Two column competitor chart showing varying percentage comparisons with multicolored bars for each row.
    Add to Wishlist
    Download
    AI Customize
    A series of four colorful gears in yellow, red, green, and blue, each labeled with a percentage and numbered captions.
    Add to Wishlist
    Download
    AI Customize
    Two side by side images of engineers with performance, punctuality, and overtime bars in green and blue below each.
    Add to Wishlist
    Download
    AI Customize
    Two side by side rectangular boxes in red and purple, each featuring icons at the top and bullet points inside.
    Add to Wishlist
    Download
    AI Customize
    Comparison chart slide displaying various metrics with color coded bars and icons indicating performance across categories.
    Add to Wishlist
    Download
    AI Customize
    A product comparison table slide showing three products evaluated across six options using green, yellow, and red dots.
    Add to Wishlist
    Download
    AI Customize
    Two arrows at the top in orange and green representing forces, with three rows of content boxes below, each numbered.
    Add to Wishlist
    Download
    AI Customize
    Slide comparing the roles of Data Scientists and Data Engineers, detailing their responsibilities and programming languages.
    Add to Wishlist
    Download
    AI Customize
    Innovate Myth Vs Facts PowerPoint And Google Slides
    Add to Wishlist
    Download
    AI Customize
    A slide diagram linking causes on the left to effects on the right, is divided into four colored captions.
    Add to Wishlist
    Download
    AI Customize
    Two-column layout illustrating Herzberg's Theory with dissatisfaction factors in red and satisfaction factors in green.
    Free
    Add to Wishlist
    Download
    AI Customize
    Slide showing Yin and Yang symbol flanked by lists of characteristics for each side Yang on the left and Yin on the right.