Internal Vs External Audit PowerPoint And Google Slides

Pack of 11 slides
P.ID : 71723
Advertisement
1.4K+ views
178 Downloads
Get Custom Slides by Experts
Instantly Access Templates in PowerPoint

Internal Vs External Audit Presentation Slides


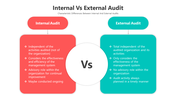
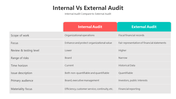
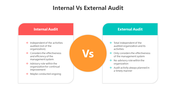
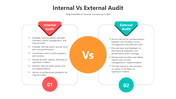
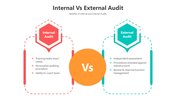
Internal vs external audit is a critical process in financial and organizational management. Internal audits are conducted by an organization's internal team to assess financial accuracy, operational efficiency, and compliance with internal policies. External audits, on the other hand, are conducted by independent auditors to verify the accuracy of financial statements and ensure compliance with external regulations. This internal audit vs external audit PPT explores the differences and benefits of both audit types, helping organizations make informed decisions about their audit strategies.  This internal audit vs external template is a valuable tool for finance professionals, auditors, and business leaders. It provides a clear, visually appealing way to explain the nuances of internal and external audits, their respective advantages, and when to use each. With fully editable slides, presenters can customize the content to suit their specific needs. The template enhances audience engagement, simplifies complex concepts, and empowers presenters to make informed recommendations. Whether for training sessions, financial meetings, or educational purposes, this template helps convey vital information effectively. Make your audit-related presentations more compelling and educational with this versatile template.

Features of the templates:


  • 100% customizable slides and easy to download.
  • Slides are available in different nodes & colors.
  • The slide contained 16:9 and 4:3 formats.
  • Easy to change the slide colors quickly.
  • It is a well-crafted template with an instant download facility.

You May Also Like These PowerPoint Templates

Add to Wishlist
Download
AI Customize
Comparison slide deck featuring different visual formats like arrows, charts, and hexagons to compare two products.
Add to Wishlist
Download
AI Customize
A slide with a comparison chart featuring two designs, each with steps and bar graphs in orange, red, blue, green and purple.
Add to Wishlist
Download
AI Customize
Comparison slide featuring red and blue hexagons on either side, with seven numbered nodes connected by lines.
Add to Wishlist
Download
AI Customize
Force Field Analysis PowerPoint Presentation Diagram
Add to Wishlist
Download
AI Customize
Comparison slide showing a bar chart with Generation X and Generation Z percentages, along with illustrated characters.
Add to Wishlist
Download
AI Customize
Gender symbols chart slide with two sections displaying groups of male and female icons, each with percentage markers.
Free
Add to Wishlist
Download
AI Customize
Top Notch Comparison Bar Graph PowerPoint Presentation
Add to Wishlist
Download
AI Customize
A slide showing two gauge meters, one labeled good in green and the other bad in red, indicating performance levels.
Add to Wishlist
Download
AI Customize
Table comparing GSM and CDMA technologies with key differences on a blue background.
Add to Wishlist
Download
AI Customize
Comparison layout with orange and red header boxes labeled with online and normal shopping, separated by a blue Vs circle.
Add to Wishlist
Download
AI Customize
Comparison slide with an orange and red vertical bar featuring a grid with gray text boxes separated by colored headers.
Add to Wishlist
Download
AI Customize
Comparison chart slide showing the differences between a leader and a supervisor, with icons and bullet points for each role.
Add to Wishlist
Download
AI Customize
A superlative slide showing three individuals, with labels from short to shortest with placeholder text.
Add to Wishlist
Download
AI Customize
Two column competitor chart showing varying percentage comparisons with multicolored bars for each row.
Add to Wishlist
Download
AI Customize
A series of four colorful gears in yellow, red, green, and blue, each labeled with a percentage and numbered captions.
Add to Wishlist
Download
AI Customize
Two side by side images of engineers with performance, punctuality, and overtime bars in green and blue below each.
Add to Wishlist
Download
AI Customize
Two side by side rectangular boxes in red and purple, each featuring icons at the top and bullet points inside.
Add to Wishlist
Download
AI Customize
Comparison chart slide displaying various metrics with color coded bars and icons indicating performance across categories.
Add to Wishlist
Download
AI Customize
A product comparison table slide showing three products evaluated across six options using green, yellow, and red dots.
Add to Wishlist
Download
AI Customize
Two arrows at the top in orange and green representing forces, with three rows of content boxes below, each numbered.
Add to Wishlist
Download
AI Customize
Innovate Myth Vs Facts PowerPoint And Google Slides
Add to Wishlist
Download
AI Customize
A slide diagram linking causes on the left to effects on the right, is divided into four colored captions.
Add to Wishlist
Download
AI Customize
Two-column layout illustrating Herzberg's Theory with dissatisfaction factors in red and satisfaction factors in green.
Free
Add to Wishlist
Download
AI Customize
Slide showing Yin and Yang symbol flanked by lists of characteristics for each side Yang on the left and Yin on the right.
Add to Wishlist
Download
AI Customize
Slide featuring a visual representation of a seesaw with icons indicating upward and downward movement with captions.
Add to Wishlist
Download
AI Customize
Comparison template showing a male-to-female ratio with percentages and text sections under each gender.
Free
Add to Wishlist
Download
AI Customize
Comparison of program and project benefits displayed in parallel columns with color coded highlights.
Add to Wishlist
Download
AI Customize
A split design with red and teal semi-circles, with four matching icons arranged in a symmetrical layout.