The Generations PowerPoint Slide Presentation Template

Comparison slide showing a bar chart with Generation X and Generation Z percentages, along with illustrated characters.
P.ID : 56435
    303 views
    26 Downloads
    Get Custom Slides by Experts
    Instantly Access Templates in PowerPoint

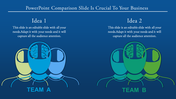
    Innovative Generation Gap Template Slide Presentation

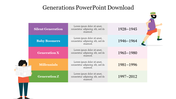
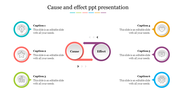
    There is a real generation gap in choices of social values, manners, and confrontations. This colorful template shows the generation gap from 1965 to 1980 and 1997 to 2012. You can discuss the percentage of male and female population during the particular years of existence. The images with both genders can add credits to your show. Explain the broad differences in attitudes and values from one generation to another without overloading texts.

    Features of the template

    • 100 % customizable slides and easy to download.
    • Slides are available in different colors
    • The slide has 4:3 and 16:9 formats.
    • Easy to change the slide colors quickly.
    • Appealing presentation to impress an audience.
    • Create feature-rich slide presentations. 
    • An eye-pleasing color slide helps to give a catchy presentation.
    • Huge space to add texts independently.
    Advertisement

    You May Also Like These PowerPoint Templates

    Add to Wishlist
    Download
    AI Customize
    Comparison slide with two interlocked triangles in orange and blue, paired with captions on both sides.
    Add to Wishlist
    Download
    AI Customize
    Comparison chart with vertical bars on blue and yellow split background, and icons for male and female with captions.
    Free
    Add to Wishlist
    Download
    AI Customize
    Four gray horizontal sections in two columns with numbered circles and arrows, each labeled with text.
    Add to Wishlist
    Download
    AI Customize
    AI vs ML slide comparing artificial intelligence and machine learning with definitions on a blue backdrop and icons.
    Add to Wishlist
    Download
    AI Customize
    Download stunning Powerpoint Comparison Chart Slide
    Add to Wishlist
    Download
    AI Customize
    Comparison of mobile technology advantages and disadvantages, with bullet points for each category.
    Add to Wishlist
    Download
    AI Customize
    Force field analysis slide with two columns, in red and green, with three numbered captions in blue, yellow, and purple.
    Add to Wishlist
    Download
    AI Customize
    Colorful cause and effect diagram PowerPoint template with icons and text sections on a white backdrop.
    Free
    Add to Wishlist
    Download
    AI Customize
    Orange background slide featuring education themed tools and two circular percentage charts for comparison.
    Add to Wishlist
    Download
    AI Customize
    Hexagonal comparison template with three specifications for two phones, connected by lines to a central balancing scale icon.
    Free
    Add to Wishlist
    Download
    AI Customize
    Cause and effect diagram with three orange circles, connected by a white loop, and labeled sections for text.
    Free
    Add to Wishlist
    Download
    AI Customize
    Creative ideas slide featuring two brain illustrations on blue scale base, highlighting balance between seeing and thinking.
    Add to Wishlist
    Download
    AI Customize
    Pros and cons comparison layout featuring a red upward and a blue downward triangle, separated by a horizontal bar.
    Free
    Add to Wishlist
    Download
    AI Customize
    Comparison slide with male icon in Circle A and female icon in Circle B, flanked by steps 01 and 02 on both sides.
    Add to Wishlist
    Download
    AI Customize
    Colorful cause and effect diagram PowerPoint template with numbered steps and a central icon for analysis.
    Add to Wishlist
    Download
    AI Customize
    Comparison slide featuring steps 01 to 06, with percentages in blue, red, green, purple, teal, and orange bars on both sides.
    Add to Wishlist
    Download
    AI Customize
    PowerPoint comparison slide featuring silhouettes of a boy and girl with percentage indicators with placeholder text.
    Add to Wishlist
    Download
    AI Customize
    Slide deck showing the contrast between management and leadership with bullet points on each side using red and teal theme.
    Add to Wishlist
    Download
    AI Customize
    Cause and effect diagram PPT template with two sections, colored in various vibrant hues and icons on a white backdrop.