Creative Force Field Analysis PPT Template


Creative Force Field Analysis PPT Template
The PowerPoint Force Field Analysis PPT Template presented by us will save your time and energy in assimilating the bundle of ideas generated in your mind to determine the reason for personal and group behavior of driving force and restricting force. So without wasting any time, you should click the download link and initiate the job of customizing this decision-making tool PPT presentation diagram for your excellent stage show.
About the template
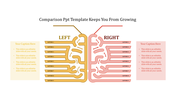
Our Force Field Analysis PPT Template is excellent for fine-tuning. This simple force field analyzing template diagram will also allow you to analyze the force field effectively according to your business capabilities. The six multi-coloured nodes will give you space to explore your ideas. Thus, start working on this PPT slide design now. Conduct the show with our Force Field Analysis PowerPoint Template Slide. Your thoughts will rise louder.
Features of this template:
1. 100% customizable slides and easy to download.
2. Slides available in different nodes & colors.
3. The slide contained 16:9 and 4:3 formats.
4. Easy to change the slide colors quickly.
5. Well-crafted template with instant download facility.
6. It looks charming and stunning.


You May Also Like These PowerPoint Templates
Add to Wishlist
Download
Edit

Add to Wishlist
Download
Edit

Add to Wishlist
Download
Edit


Add to Wishlist
Download
Edit


Add to Wishlist
Download
Edit

Add to Wishlist
Download
Edit

Add to Wishlist
Download
Edit

Add to Wishlist
Download
Edit

Add to Wishlist
Download
Edit

Add to Wishlist
Download
Edit

Add to Wishlist
Download
Edit

Add to Wishlist
Download
Edit

Add to Wishlist
Download
Edit

Add to Wishlist
Download
Edit

Add to Wishlist
Download
Edit


Add to Wishlist
Download
Edit
