Attractive PowerPoint Comparison Layout Presentation

Pros and cons comparison layout featuring a red upward and a blue downward triangle, separated by a horizontal bar.
P.ID : 67769
    21 slides
    Comparison slide deck featuring different visual formats like arrows, charts, and hexagons to compare two products.
    11 slides
    Best Fixed Vs Growth Mindset PPT And Google Slides Templates
    11 slides
    A pack of achievements and challenges slides featuring a comparison of successful outcomes with various colorful designs.
    10 slides
    Amazing Build Vs Buy PowerPoint And Google Slides Templates
    446 views
    63 Downloads
    Get Custom Slides by Experts
    Instantly Access Templates in PowerPoint

    Two Noded Comparison PowerPoint Template

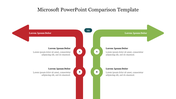
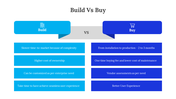
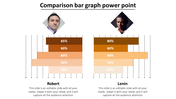
    Looking for a creative way to visualize the pros and cons? You have landed at the right place. SlideEgg offers you this creative PowerPoint Comparison Layout Slide to help you present the comparisons in a visually engaging manner. The creativeness of this comparison PPT slide will grab your audience's eyes. It is also 100% editable. Download it right now!

    About the template

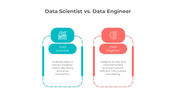
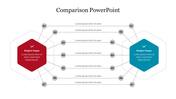
    The Creative PowerPoint Comparison Layout Slide has beautiful red and blue color 3D triangles. Both triangles are placed in a horizontal line and faced in opposite directions. The red color triangle indicates the pros and blue for the cons. Each triangle also includes text blocks to present the comparison. Using this colorful slide, you can make visually stunning presentations. You can also try our Compare And Contrast PowerPoint Template available at SlideEgg!

    Features of the template

    • 100% customizable slides and easy to download.
    • Slides are available in different nodes & colors.
    • The slide contained 16:9 and 4:3 formats.
    • Easy to change the slide colors quickly.
    • Well-crafted template with instant download facility.
    • The best slide to present the pros and cons.
    Advertisement

    You May Also Like These PowerPoint Templates

    Add to Wishlist
    Download
    AI Customize
    Comparison layout with orange and red header boxes labeled with online and normal shopping, separated by a blue Vs circle.
    Add to Wishlist
    Download
    AI Customize
    Comparison slide with an orange and red vertical bar featuring a grid with gray text boxes separated by colored headers.
    Add to Wishlist
    Download
    AI Customize
    Comparison chart slide showing the differences between a leader and a supervisor, with icons and bullet points for each role.
    Add to Wishlist
    Download
    AI Customize
    A superlative slide showing three individuals, with labels from short to shortest with placeholder text.
    Add to Wishlist
    Download
    AI Customize
    Two column competitor chart showing varying percentage comparisons with multicolored bars for each row.
    Add to Wishlist
    Download
    AI Customize
    A series of four colorful gears in yellow, red, green, and blue, each labeled with a percentage and numbered captions.
    Add to Wishlist
    Download
    AI Customize
    Two side by side images of engineers with performance, punctuality, and overtime bars in green and blue below each.
    Add to Wishlist
    Download
    AI Customize
    Two side by side rectangular boxes in red and purple, each featuring icons at the top and bullet points inside.
    Add to Wishlist
    Download
    AI Customize
    Comparison chart slide displaying various metrics with color coded bars and icons indicating performance across categories.
    Add to Wishlist
    Download
    AI Customize
    A product comparison table slide showing three products evaluated across six options using green, yellow, and red dots.
    Add to Wishlist
    Download
    AI Customize
    Two arrows at the top in orange and green representing forces, with three rows of content boxes below, each numbered.
    Add to Wishlist
    Download
    AI Customize
    Slide comparing the roles of Data Scientists and Data Engineers, detailing their responsibilities and programming languages.
    Add to Wishlist
    Download
    AI Customize
    Innovate Myth Vs Facts PowerPoint And Google Slides
    Add to Wishlist
    Download
    AI Customize
    A slide diagram linking causes on the left to effects on the right, is divided into four colored captions.
    Add to Wishlist
    Download
    AI Customize
    Two-column layout illustrating Herzberg's Theory with dissatisfaction factors in red and satisfaction factors in green.