Free - Gsm vs Cdma Powerpoint — Make Every Comparison Unmissable


Gsm Vs Cdma PowerPoint — PowerPoint Template
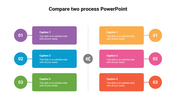
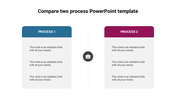
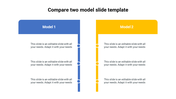
Side-by-side comparisons written in prose are hard to process. A comparison slide makes differences obvious in seconds.
This GSM Vs CDMA PowerPoint gives you a clean, fully editable presentation slide that's ready to use the moment you download it. The slide features table comparing GSM and CDMA technologies with key differences on a blue background. Drop it into your deck, replace the placeholder text, and you're done.
What's Inside
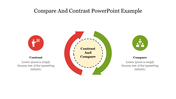
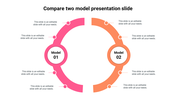
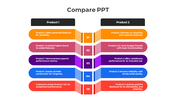
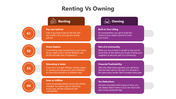
A focused single-slide design — built for one strong visual message, fast to customize — text, colors, icons, and layout are all yours to adjust. Design variations include: GSM Vs CDMA, Compare GSM Vs CDMA, Different Between GSM Vs CDMA, Comparison GSM Vs CDMA. Match your brand, adapt the layout, change the colors — it takes minutes, not hours.
Who This Is For
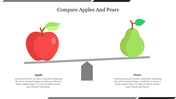
Built for product managers, marketers, sales teams, and analysts presenting feature comparisons, vendor evaluations, or option trade-offs. No design background needed — just open, edit, and present.
Formats & Download
Available for PowerPoint. Download instantly — no design skills required. Everything is fully customizable to match your brand or topic.
Key Features
- Fully editable — text, colors, icons, and layout
- Compatible with PowerPoint
- 16:9 widescreen format — presentation-ready
- Clean, professional design — no clutter
- Premium — instant download access
Explore more Compare deck templates to find the right fit for your next presentation.
Related collections: Competitor analysis templates | SWOT templates


You May Also Like These PowerPoint Templates
Showing0 of69,218 templates