Free - Effective Comparison Chart Template Presentation Slide
Free

 Canva
Canva


Free - Effective Comparison Chart Template Presentation Slide
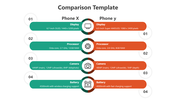
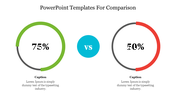
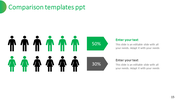
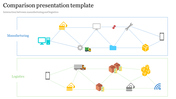
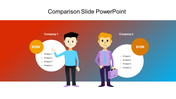
This is a Free Comparison Chart Template that consists of Various Comparison Slides, you can use it to visually describe your business model, compare your performance with your competitor, compare products, currency, etc. This Chart/Diagram works on any field such as Finance, Annual Report, Investment and many things. All Graphics are editable from shapes and colors, also we provide a graphic assets.
About the template
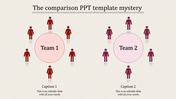
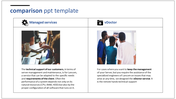
The Comparison PPT template is a ready-made format that makes the document easy to present and understand. It is a twelve noded template in which you can compare the product or services in terms of their overall aspect, efficiency, and cost effectiveness. Free Comparison Chart Template is fully customizable. You can use this tool to make your work noteworthy. Download these creative PowerPoint Template Three Columns and save your working hours.
Features of this template:
1. 100 % customizable slides and easy to download.
2. Slides available in different nodes & colors.
3. The slide contained 16:9 and 4:3 format.
4. Easy to change the slide colors quickly.
5. Well-crafted template with instant download facility.
6. Creative, colorful slide.


You May Also Like These PowerPoint Templates
Add to Wishlist
Download
Edit

Add to Wishlist
Download
Edit

Add to Wishlist
Download
Edit

Add to Wishlist
Download
Edit

Add to Wishlist
Download
Edit

Add to Wishlist
Download
Edit

Add to Wishlist
Download
Edit


Add to Wishlist
Download
Edit


Add to Wishlist
Download
Edit

Add to Wishlist
Download
Edit

Add to Wishlist
Download
Edit

Add to Wishlist
Download
Edit

Add to Wishlist
Download
Edit

Add to Wishlist
Download
Edit

Add to Wishlist
Download
Edit

Add to Wishlist
Download
Edit

Add to Wishlist
Download
Edit
