Male And Female Ratio PowerPoint Template & Google Slides

Comparison slide showing male and female icons with percentages, 45% for men and 75% for women.
P.ID : 56496
    886 views
    104 Downloads
    Get Custom Slides by Experts
    Instantly Access Templates in PowerPoint

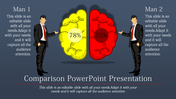
    The Male and Female Ratio Presentation Slide

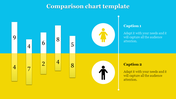
    This Male And Female Ratio is an excellent way to present the different between men and women. The male to female ratio refers to the number of males relative to the number of females in a given population or group. This ratio can vary widely depending on various factors such as geography, age, culture, and socioeconomic status. Understanding the male to female ratio is important for understanding demographics, social dynamics, and public health issues. You can easily use this template and text placeholders make it easy to create a presentation that impresses your audience.


    Features of the template

    • 100% customizable slides and easy to download.
    • Slides are available in different nodes & colors.
    • The slide contains 16:9 and 4:3 formats.
    • Easy to change the colors of the slide quickly.
    • Well-crafted template with an instant download facility.
    • Amicable & quick edit options.
    • It has the best customer review theme.
    • Highly compatible with PowerPoint and Google Slides.
    Advertisement

    You May Also Like These PowerPoint Templates

    Add to Wishlist
    Download
    AI Customize
    Colorful cause and effect diagram PowerPoint template with icons and text sections on a white backdrop.
    Free
    Add to Wishlist
    Download
    AI Customize
    Orange background slide featuring education themed tools and two circular percentage charts for comparison.
    Add to Wishlist
    Download
    AI Customize
    Hexagonal comparison template with three specifications for two phones, connected by lines to a central balancing scale icon.
    Free
    Add to Wishlist
    Download
    AI Customize
    Cause and effect diagram with three orange circles, connected by a white loop, and labeled sections for text.
    Free
    Add to Wishlist
    Download
    AI Customize
    Creative ideas slide featuring two brain illustrations on blue scale base, highlighting balance between seeing and thinking.
    Add to Wishlist
    Download
    AI Customize
    Pros and cons comparison layout featuring a red upward and a blue downward triangle, separated by a horizontal bar.
    Free
    Add to Wishlist
    Download
    AI Customize
    Comparison slide with male icon in Circle A and female icon in Circle B, flanked by steps 01 and 02 on both sides.
    Add to Wishlist
    Download
    AI Customize
    Colorful cause and effect diagram PowerPoint template with numbered steps and a central icon for analysis.
    Add to Wishlist
    Download
    AI Customize
    Comparison slide featuring steps 01 to 06, with percentages in blue, red, green, purple, teal, and orange bars on both sides.
    Add to Wishlist
    Download
    AI Customize
    PowerPoint comparison slide featuring silhouettes of a boy and girl with percentage indicators with placeholder text.
    Add to Wishlist
    Download
    AI Customize
    Slide deck showing the contrast between management and leadership with bullet points on each side using red and teal theme.
    Add to Wishlist
    Download
    AI Customize
    Cause and effect diagram PPT template with two sections, colored in various vibrant hues and icons on a white backdrop.
    Add to Wishlist
    Download
    AI Customize
    Illustration of a scale comparing two concepts with icons on each side, symbolizing balance and comparison with captions.
    Add to Wishlist
    Download
    AI Customize
    Two column layout with rectangular boxes using purple and orange hues to separate primary and support activities.
    Add to Wishlist
    Download
    AI Customize
    Comparison layout with two gray batteries, featuring red and teal levels showing different percentages on a dark backdrop.
    Add to Wishlist
    Download
    AI Customize
    Easy To Editable Compare PowerPoint And Google Slides
    Free
    Add to Wishlist
    Download
    AI Customize
    Green circular sections connected to a central icon, with three numbered circles on both sides and text.
    Free
    Add to Wishlist
    Download
    AI Customize
    Red cause-and-effect layout with wavy lines connecting two columns, each having three sections, with placeholder text.