Free - Effective Comparison PPT Template Presentation Designs

Free
A professional comparison slide featuring horizontal bar graphs displaying various percentages alongside captions with icons.
P.ID : 12109
    4.5K+ views
    719 Downloads
    Get Custom Slides by Experts
    Instantly Access Templates in PowerPoint

    Dazzling Comparison Templates For Your Presentation 

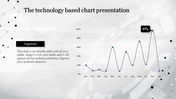
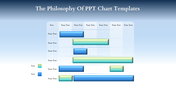
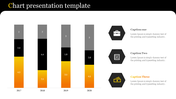
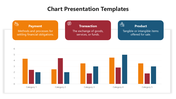
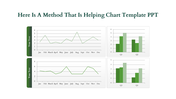
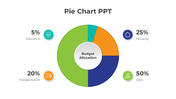
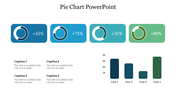
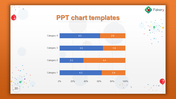
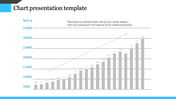
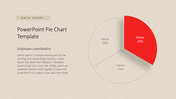
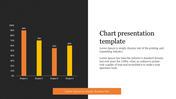
    Comparison PPT templates are a versatile instrument for firms looking to present data in a clear and brief manner. These templates provide pre-designed slides with multiple comparison layouts, allowing users to effectively showcase differences between products, services, strategies, or data. With a variety of charts, tables, and graphics to choose from, these templates enable users to display complex information in a visually appealing and easy-to-understand format. If you are preparing a sales pitch, marketing presentation, or business report, our Comparison PPT templates never fail to bring you laurels.

    Features of this template

    • 100% customizable slides and easy to download
    • Slides are available in different nodes & colors.
    • The slides contain 16:9 and 4:3 formats.
    • Easy to change the slide colors quickly.
    • Well-crafted template with an instant download facility.
    • Absolutely brings profit to your business.
    • The structured nodes are apt for your professional work.
    • Can be accessed on google slides as well.
    Advertisement

    You May Also Like These PowerPoint Templates

    Add to Wishlist
    Download
    AI Customize
    Gradient-styled horizontal bar chart with blue and green bars, labeled text areas, and a light blue background.
    Add to Wishlist
    Download
    AI Customize
    Bar chart with four vertical orange columns, gray numbered tops, captions, and a dollar sign axis on a white background.
    Free
    Add to Wishlist
    Download
    AI Customize
    Bubble chart on the right with varying circle sizes and a dark blue section on the left featuring three headings and text.
    Add to Wishlist
    Download
    AI Customize
    Chart presentation template displaying monthly data for Visitors, New Customers, and Leads with bar and line charts.
    Add to Wishlist
    Download
    AI Customize
    Versatile PowerPoint Chart Templates for Data Insights
    Add to Wishlist
    Download
    AI Customize
    Horizontal bar chart with three color-coded series, labeled values, and a left side legend with numbered captions.
    Add to Wishlist
    Download
    AI Customize
    Slide deck with multiple circular progress bars in various colors, showing percentages and captions below.
    Add to Wishlist
    Download
    AI Customize
    Slide with a horizontal bar chart on the left and 3D cylindrical percentage charts in blue, green, and teal, on the right.
    Add to Wishlist
    Download
    AI Customize
    Horizontal bar chart with four labeld sections A to D, in purple, pink, teal, and blue, and captions below.
    Add to Wishlist
    Download
    AI Customize
    Business chart slide with a red and black line graph on the left, a red bar chart on the right, and two description sections.
    Free
    Add to Wishlist
    Download
    AI Customize
    Layered area chart with Series 1 in yellow, Series 2 in orange, and Series 3 in black, showing data trends over time.
    Add to Wishlist
    Download
    AI Customize
    Clustered bar chart comparing data across quarters with horizontal bars in various colors.
    Add to Wishlist
    Download
    AI Customize
    Slide with three vertical boxes in blue, red, and green banners, and rounded icons labeled K, W, and L for learning stages.
    Add to Wishlist
    Download
    AI Customize
    Line graph infographic showing data from 2015 to 2020, with three colored lines in purple, yellow, and green, and text.
    Add to Wishlist
    Download
    AI Customize
    Donut chart in blue and orange displaying percentage, with matching colored caption boxes on either side.
    Add to Wishlist
    Download
    AI Customize
    Our Predesigned Chart Templates PPT Slides Designs
    Add to Wishlist
    Download
    AI Customize
    KWL chart slide with three columns in blue, red, and gold, representing learning insights.
    Add to Wishlist
    Download
    AI Customize
    Infographic with four bar graphs, each showing data points A to D, and captions areas in green boxes.