Chart PPT Presentation Template for Clear Data Visuals

Bar Chart Presentation Template
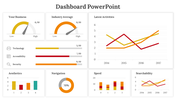
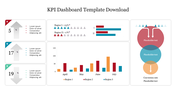
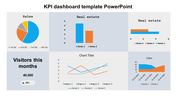
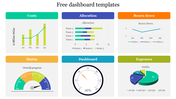
This professional chart presentation template has a sleek, modern look that will make your presentations stand out. It features a simple design with a dynamic bar chart in a dark box on a white background. You can easily add captions to highlight key points, making your data clear and impactful. This template is perfect for anyone who needs to present data in a visually appealing way.
Whether you're a student sharing research, a professional pitching a business proposal, or a teacher explaining complex ideas, this template will make your job easier. You can personalize it with your data and change the colors to match your brand. Its user-friendly design lets you focus on your message with confidence. Ready to make your presentations shine? Download the template today and take your data presentations to the next level!
Features of the template
- Slides are available in different nodes & colors.
- Easy to change the slide colors.
- Well-crafted template with instant download.
- Highly compatible with PowerPoint and Google Slides.


You May Also Like These PowerPoint Templates
Add to Wishlist
Download
Edit

Add to Wishlist
Download
Edit

Add to Wishlist
Download
Edit

Add to Wishlist
Download
Edit

Add to Wishlist
Download
Edit

Add to Wishlist
Download
Edit


Add to Wishlist
Download
Edit

Add to Wishlist
Download
Edit

Add to Wishlist
Download
Edit

Add to Wishlist
Download
Edit

Add to Wishlist
Download
Edit

Add to Wishlist
Download
Edit


Add to Wishlist
Download
Edit

Add to Wishlist
Download
Edit

Add to Wishlist
Download
Edit

Add to Wishlist
Download
Edit

Add to Wishlist
Download
Edit

