Comparison Chart PowerPoint Template and Google Slides

Comparison chart slide with two bar graphs comparing four categories with values ranging from 20 to 80 with percentages.
P.ID : 5479
    2K+ views
    95 Downloads
    Get Custom Slides by Experts
    Instantly Access Templates in PowerPoint

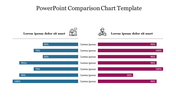
    Comparison Chart Presentation Slide


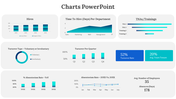
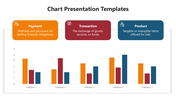
    A comparison chart is an essential tool in business, allowing decision-makers to quickly and efficiently compare and contrast various options for different projects. This slide helps present information clearly and concisely, enabling executives to make informed decisions that drive growth and profitability.

    About the template:


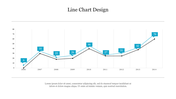
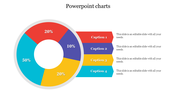
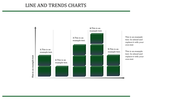
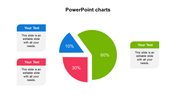
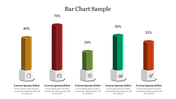
    This template features a well-designed layout with graphs and bar diagrams, perfect for comparing products, services, pricing, and performance metrics. It’s a powerful tool to visually represent data, helping you make your comparisons vivid and easy to understand.

    Features of the Template:


    • 100 % customizable slides and easy to download.
    • Slides available in different nodes & colors.
    • The slide contained 16:9 and 4:3 format.
    • Easy to change the slide colors quickly.
    • Well-crafted template with instant download facility.
    • The charts will help you to present the comparisons more clearly.
    Advertisement

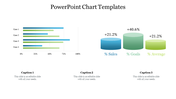
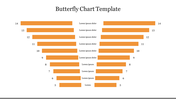
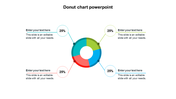
    You May Also Like These PowerPoint Templates

    Add to Wishlist
    Download
    AI Customize
    Innovative Pie Chart PowerPoint Template Presentation
    Add to Wishlist
    Download
    AI Customize
    PowerPoint slide with a bar chart showing data for 2017, 2018, 2019, and 2020 in colorful bars.
    Add to Wishlist
    Download
    AI Customize
    Slide with a three part 3D pie chart, featuring a highlighted red segment, on a beige background.
    Add to Wishlist
    Download
    AI Customize
    Chart presentation template with a bar graph showing the progress of four projects with percentages.
    Free
    Add to Wishlist
    Download
    AI Customize
    Line chart template with three data series in blue, teal, black, and text sections.
    Add to Wishlist
    Download
    AI Customize
    Gradient-styled horizontal bar chart with blue and green bars, labeled text areas, and a light blue background.
    Add to Wishlist
    Download
    AI Customize
    Bar chart with four vertical orange columns, gray numbered tops, captions, and a dollar sign axis on a white background.
    Free
    Add to Wishlist
    Download
    AI Customize
    Bubble chart on the right with varying circle sizes and a dark blue section on the left featuring three headings and text.
    Add to Wishlist
    Download
    AI Customize
    Chart presentation template displaying monthly data for Visitors, New Customers, and Leads with bar and line charts.
    Add to Wishlist
    Download
    AI Customize
    Gantt chart PowerPoint template displaying project tasks over a four week timeline with placeholder text.
    Add to Wishlist
    Download
    AI Customize
    Versatile PowerPoint Chart Templates for Data Insights
    Add to Wishlist
    Download
    AI Customize
    Horizontal bar chart with three color-coded series, labeled values, and a left side legend with numbered captions.
    Add to Wishlist
    Download
    AI Customize
    Slide deck with multiple circular progress bars in various colors, showing percentages and captions below.
    Add to Wishlist
    Download
    AI Customize
    Slide with a horizontal bar chart on the left and 3D cylindrical percentage charts in blue, green, and teal, on the right.
    Add to Wishlist
    Download
    AI Customize
    Horizontal bar chart with four labeld sections A to D, in purple, pink, teal, and blue, and captions below.