Chart PowerPoint Presentation Template and Google Slides Themes

Slide showcasing a bar chart with three categories, displaying percentages for each category in blue and gray tones.
P.ID : 34760
    348 views
    13 Downloads
    Get Custom Slides by Experts
    Instantly Access Templates in PowerPoint

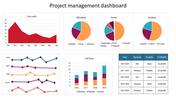
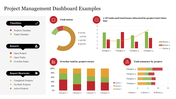
    Excellent Chart Presentation Template


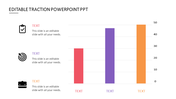
    Curious about enhancing your presentations? Our Chart PowerPoint Presentation template is here to help! With a striking bar chart image and percentage mark set against a captivating blue backdrop, your data will stand out effortlessly. Who can use these slides? Professionals, educators, and students seeking impactful data visualization. Wondering how our template can assist you? By providing a visually engaging bar chart layout, it simplifies complex data representation and ensures clarity in your presentations. Elevate your slides and leave a lasting impression. Download now and make your data speak volumes!

    Feature of the template

    • 100% customizable slides and easy to download.
    • Slides are available in different nodes & colors.
    • The slide is contained in 16:9 and 4:3 format.
    • Easy to change the slide colors quickly.
    • Well-crafted template with an instant download facility. 
    Advertisement

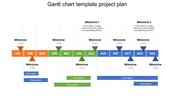
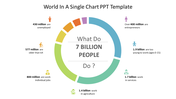
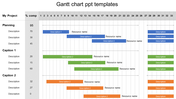
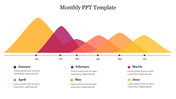
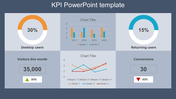
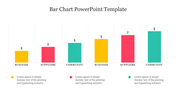
    You May Also Like These PowerPoint Templates

    Add to Wishlist
    Download
    AI Customize
    Six semicircular gauges with colored indicators in red, purple, blue, yellow, pink, and green on a white backdrop.
    Free
    Add to Wishlist
    Download
    AI Customize
    Slide showcasing three different types of colored charts an area chart, a bar chart, and a line chart, with captions below.
    Add to Wishlist
    Download
    AI Customize
    Three pie charts with segmented sections and percentage labels, each chart featuring placeholder text below.
    Add to Wishlist
    Download
    AI Customize
    A pie chart template with three circular charts representing each with text and icons beside them.
    Add to Wishlist
    Download
    AI Customize
    Area chart with a teal base and five markers in yellow, red, and maroon shades representing growth percentages.
    Add to Wishlist
    Download
    AI Customize
    Awesome Dashboard PPT Template Free Download Slides
    Add to Wishlist
    Download
    AI Customize
    Pie Chart PowerPoint with Segmented Circles Slides
    Add to Wishlist
    Download
    AI Customize
    Template displaying a structured flowchart for KPI types, categorized into qualitative and quantitative evaluations.
    Add to Wishlist
    Download
    AI Customize
    Illustration of a chart with yellow, red, and green horizontal bars displaying percentages and paper boat icons on waves.
    Add to Wishlist
    Download
    AI Customize
    KPI dashboard showcasing private school growth with yellow bar charts indicating critical, low, none, and high levels.
    Add to Wishlist
    Download
    AI Customize
    A vertical green color bar chart slide displaying loss data from 2014 to 2019, with the title at the top.
    Add to Wishlist
    Download
    AI Customize
    Dashboard slide showing colour coded plant growth chart with progress ring visuals and percentages.
    Add to Wishlist
    Download
    AI Customize
    Dashboard slide showing sales bar chart with a highlighted value and a gauge representing business metrics.
    Add to Wishlist
    Download
    AI Customize
    A colorful pie chart diagram with concentric circles showing percentages for different data categories in 2021.
    Add to Wishlist
    Download
    AI Customize
    KPI dashboard layout with blue and green line graphs at the top and shaded bar charts at the bottom in gradient colors.
    Free
    Add to Wishlist
    Download
    AI Customize
    Gantt chart slide showing six tasks with progress bars, each reflecting completion levels ranging from 30% to 80%.
    Add to Wishlist
    Download
    AI Customize
    Annual report slide with five sections of pie chart, bar graphs, and profit figures, in green and blue tones.