Infographic Pie Chart PowerPoint Presentation Template

A colorful pie chart diagram with concentric circles showing percentages for different data categories in 2021.
P.ID : 4284
    689 views
    58 Downloads
    Get Custom Slides by Experts
    Instantly Access Templates in PowerPoint

    Infographic Pie Chart PowerPoint Presentation 

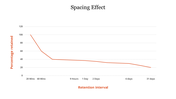
    Transform your data into engaging visual stories with the "Infographic Pie Chart PowerPoint Presentation." This dynamic slide features a pie chart representing the percentage trends over a 4-year period (2021-2024), each year distinguished by vibrant colors - purple, blue, orange, and green. With percentages shifting from 80% to 40%, this template is perfect for illustrating changing trends or emphasizing key data points.

    Designed for analysts, presenters, and educators, this template is a versatile tool for data-driven storytelling. Whether you're presenting business growth, financial data, or project milestones, this visually appealing chart simplifies complex information.

    Take advantage of the template's adaptability, available in "16:9" and "4:3" and zip formats, ensuring compatibility with various presentation setups. Download this template now to infuse creativity into your data presentations, captivate your audience, and effectively communicate your insights. Upgrade your visual communication and make your presentations more impactful. Download today for compelling data visualization that speaks volumes.
    Advertisement

    You May Also Like These PowerPoint Templates

    Add to Wishlist
    Download
    AI Customize
    Chart slide featuring a weekly schedule with multiple rows and columns with placeholder text gradient blue and green bars.
    Add to Wishlist
    Download
    AI Customize
    Infographic with bar charts, percentage stats, and a layered blue 3D smartphone like structure with four captions.
    Free
    Add to Wishlist
    Download
    AI Customize
    Line chart with green and yellow lines showing three data series, text placeholders and a starburst badge.
    Add to Wishlist
    Download
    AI Customize
    Slide featuring two line graphs and bar charts in green, comparing data across months and quarters.
    Add to Wishlist
    Download
    AI Customize
    Chart presentation template with a bar graph showing the progress of four projects with percentages.
    Free
    Add to Wishlist
    Download
    AI Customize
    Line chart template with three data series in blue, teal, black, and text sections.
    Add to Wishlist
    Download
    AI Customize
    Gradient-styled horizontal bar chart with blue and green bars, labeled text areas, and a light blue background.
    Add to Wishlist
    Download
    AI Customize
    Bar chart with four vertical orange columns, gray numbered tops, captions, and a dollar sign axis on a white background.
    Free
    Add to Wishlist
    Download
    AI Customize
    Bubble chart on the right with varying circle sizes and a dark blue section on the left featuring three headings and text.
    Add to Wishlist
    Download
    AI Customize
    Chart presentation template displaying monthly data for Visitors, New Customers, and Leads with bar and line charts.
    Add to Wishlist
    Download
    AI Customize
    Versatile PowerPoint Chart Templates for Data Insights
    Add to Wishlist
    Download
    AI Customize
    Horizontal bar chart with three color-coded series, labeled values, and a left side legend with numbered captions.
    Add to Wishlist
    Download
    AI Customize
    Slide deck with multiple circular progress bars in various colors, showing percentages and captions below.
    Add to Wishlist
    Download
    AI Customize
    Slide with a horizontal bar chart on the left and 3D cylindrical percentage charts in blue, green, and teal, on the right.
    Add to Wishlist
    Download
    AI Customize
    Horizontal bar chart with four labeld sections A to D, in purple, pink, teal, and blue, and captions below.