Pie Chart PowerPoint Template and Google Slides Themes

 Canva
Canva
Pie Chart PowerPoint Template and Google Slides Themes
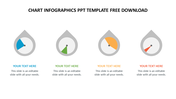
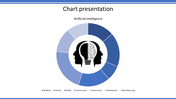
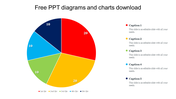
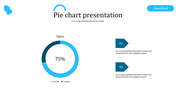
Enhance your data presentations with our Pie Chart PowerPoint and Google Slides template. This template features a visually appealing chocolate-colored background, setting a rich and engaging backdrop for your data visualization. The pie chart highlights a segment in vibrant red, effectively emphasizing key information or a critical data point.
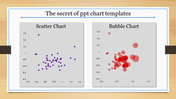
Ideal for analysts, business professionals, educators, and researchers, this template helps you present data insights, percentages, or market shares with clarity and impact. Whether you're illustrating financial data, survey results, or demographic trends, this design provides a clear and visually compelling way to convey complex information.
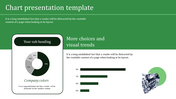
Empower your presentations with this customizable template, designed to elevate your data storytelling and engage your audience effectively. Capture attention and highlight crucial data points with clarity and professionalism using this versatile pie chart template.
Features of the template
- 100% customizable slides and easy to download.
- Slides are available in different nodes & colors.
- The slide contains 16:9 and 4:3 formats.
- It is easy to change the colors of the slide quickly.
- Well-crafted template with an instant download facility.


You May Also Like These PowerPoint Templates
Add to Wishlist
Download
Edit


Add to Wishlist
Download
Edit

Add to Wishlist
Download
Edit

Add to Wishlist
Download
Edit

Add to Wishlist
Download
Edit

Add to Wishlist
Download
Edit

Add to Wishlist
Download
Edit

Add to Wishlist
Download
Edit

Add to Wishlist
Download
Edit

Add to Wishlist
Download
Edit


Add to Wishlist
Download
Edit

Add to Wishlist
Download
Edit


Add to Wishlist
Download
Edit


Add to Wishlist
Download
Edit

Add to Wishlist
Download
Edit

