Free - Dashboard PowerPoint Template And Google Slides Themes

Free
Dashboard graphic featuring a circular speedometer with a red needle, surrounded by text labels for various business metrics.
P.ID : 35766
    277 views
    96 Downloads
    Get Custom Slides by Experts
    Instantly Access Templates in PowerPoint

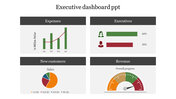
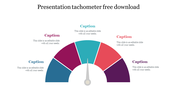
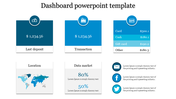
    Dashboard Presentation Template

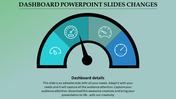
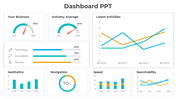
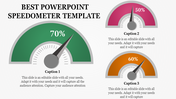
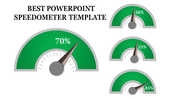
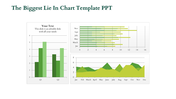
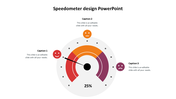
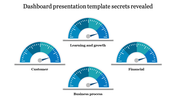
    Revolutionize your data visualization with Our Dashboard PowerPoint template and Google Slides. It is here to make your data shine without the confusion. It's like having a  clear roadmap for your information. With a cool speedometer at the centre and five easy-to-use text boxes, you can show off even the trickiest data in a way that everyone can understand. Whether you're a pro, a student, or just someone who wants to nail their presentations, this template has your back. It works for all sorts of stuff, like explaining projects and KPI dashboards. With this template, you can break down your goals, share important info, and show off your best findings effortlessly. So, say goodbye to messy dashboards and hello to clear, engaging presentations  and start turning your data into something truly awesome!

    Features of the template:

    • Slides are available in different nodes & colors.
    • Easy to change the slide colors.
    • Well-crafted template with instant download.
    Advertisement

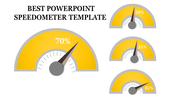
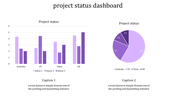
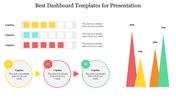
    You May Also Like These PowerPoint Templates

    Add to Wishlist
    Download
    AI Customize
    Logistics performance dashboard with two circular charts for failure distribution and delivery tracking, and a gauge meter.
    Add to Wishlist
    Download
    AI Customize
    Tachometer PPT slide with 4 colorful gauges in red, orange, green, and blue, each with caption sections on a white backdrop.
    Add to Wishlist
    Download
    AI Customize
    Dashboard PowerPoint slide featuring pie, bar, and line charts with placeholder text and data visualization.
    Free
    Add to Wishlist
    Download
    AI Customize
    Business slide featuring a circular layout with four orange sections and icons representing key aspects of business.
    Add to Wishlist
    Download
    AI Customize
    Color coded modern dashboard gauge with six labeled sections and a central pointer with captions.
    Add to Wishlist
    Download
    AI Customize
    Slide with a businesswoman standing beside a colorful ring chart labeled on a board and four captions on the right.
    Add to Wishlist
    Download
    AI Customize
    Best Elegant Tachometer Presentation Download Template
    Free
    Add to Wishlist
    Download
    AI Customize
    Circular speedometer design with a red progress arc from 5.5 to 6.5 KM, and a gray caption box for customizable text content.
    Add to Wishlist
    Download
    AI Customize
    Speedometer style dashboard template with green, yellow, and red zones for progress tracking with captions.
    Add to Wishlist
    Download
    AI Customize
    Slide showcasing data visualizations using donut, bar, column, line charts, and a text box, using yellow highlights.
    Add to Wishlist
    Download
    AI Customize
    Business dashboard slide with a monitor displaying charts and graphs, paired with four colored icons and captions.
    Add to Wishlist
    Download
    AI Customize
    Slide design featuring three green speedometer graphics displaying different progress levels, each paired with a caption.
    Add to Wishlist
    Download
    AI Customize
    Sales performance dashboard with four circular progress charts in orange, blue, purple, and green, showing percentage values.
    Add to Wishlist
    Download
    AI Customize
    Dashboard slide featuring six sections with graphs and metrics for annual performance in blue and green.
    Add to Wishlist
    Download
    AI Customize
    Effective Dashboard PowerPoint Templates Design
    Add to Wishlist
    Download
    AI Customize
    Dashboard slide with a circular chart in blue shades, featuring percentage labels, and five icons with text on the right.
    Add to Wishlist
    Download
    AI Customize
    Dashboard slide with a pie chart, stacked area chart, and multiple colored rectangular boxes displaying metrics.
    Add to Wishlist
    Download
    AI Customize
    Best Dashboard Sales Performance Reports Revenue Charts