Get stunning Speedometer Slide PPT Design presentation


Exclusive speedometer slide ppt template
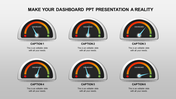
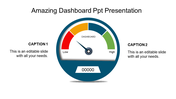
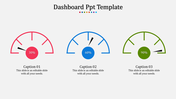
How about downloading this download speedometer slide PPT template for your fantastic presentation?. The template effectively has three nodes that you can use to explain the topic. This template is free of cost and can be downloaded quickly.
This can be effective with vibrant colors added to it. The template is neat, with a text area that can bring more details about the topic.
The template is an exclusive semi-circle design that you can edit easily. The template is fully customized and so downloading and editing are easier.
Download this download speedometer slide PPT template and gain the audience's attention. You will be able to add on more user-friendly features to enhance the view of the presentation. Try now!.
Features of this Template:
1. 100% customizable slides
2. easy to download.
3. Slides available in different nodes & colors.
4. The slide contained 16:9 and 4:3 formats.
5. Easy to change the slide colors quickly.
6. Well-crafted template with instant download facility.
7. Creative design with text area.


You May Also Like These PowerPoint Templates
Add to Wishlist
Download
Edit

Add to Wishlist
Download
Edit

Add to Wishlist
Download
Edit

Add to Wishlist
Download
Edit

Add to Wishlist
Download
Edit


Add to Wishlist
Download
Edit

Add to Wishlist
Download
Edit

Add to Wishlist
Download
Edit


Add to Wishlist
Download
Edit


Add to Wishlist
Download
Edit

Add to Wishlist
Download
Edit

Add to Wishlist
Download
Edit

Add to Wishlist
Download
Edit

Add to Wishlist
Download
Edit

Add to Wishlist
Download
Edit
