Executive Dashboard PPT Google Slides Presentation Template

Executive dashboard with a world map showing sales distribution and expense meters.
P.ID : 3941
    3.3K+ views
    287 Downloads
    Get Custom Slides by Experts
    Instantly Access Templates in PowerPoint

    Executive Dashboard Presentation Slide


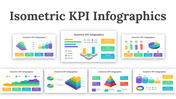
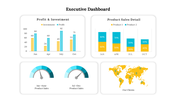
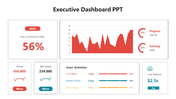
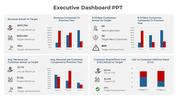
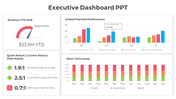
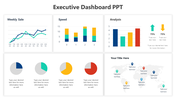
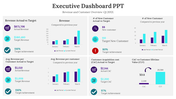
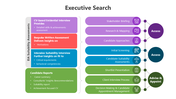
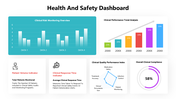
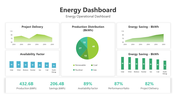
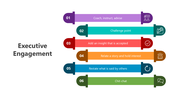
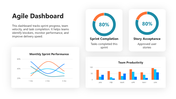
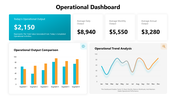
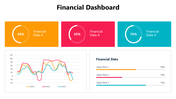
    In sales and business, the executive dashboard plays a vital role in providing a comprehensive view of the organization's performance. It enables executives to track sales trends, monitor customer behavior, and analyze market data to identify opportunities for growth. By providing a real-time snapshot of the business, the executive dashboard empowers decision-makers to take action quickly and stay ahead of the competition. Furthermore here this slide has interesting charts, graphs and maps which helps to present the data on current state of the business.


    Features of the template:

    • 100 % customizable slides and easy to download. 
    • This slide is contained in 16:9 and 4:3 format.
    • It is a well-crafted template with an instant download facility.
    • A professional-looking template with elegant visuals.

    • It can be used in PowerPoint and Google Slide.

    Advertisement

    You May Also Like These PowerPoint Templates

    Add to Wishlist
    Download
    AI Customize
    Slide deck of energy dashboards displaying data visualizations like pie charts, bar and line graphs, in green shades.
    Free
    Add to Wishlist
    Download
    AI Customize
    KPI dashboard layout with blue semicircle gauges and line charts representing social media performance metrics.
    Free
    Add to Wishlist
    Download
    AI Customize
    Dashboard layout with three semicircular gauges in orange and brown tones, paired with captions, on a beige background.
    Add to Wishlist
    Download
    AI Customize
    Dashboard-themed slide with semi-circle charts for business analysis, featuring metrics and reflective silhouettes at the bottom.
    Add to Wishlist
    Download
    AI Customize
    Bar chart infographic with four blue bars for kpi forecasts, a line graph overlay, and a man with a magnifying glass.
    Add to Wishlist
    Download
    AI Customize
    Executive dashboard slide featuring bar graphs and pie charts comparing project data over three years, with text boxes.
    Add to Wishlist
    Download
    AI Customize
    Four colored circular progress, one is higlighted in a box with a pie chart, and a bar chart labelled with sections.
    Add to Wishlist
    Download
    AI Customize
    Key performance indicator slide displaying data bars, percentages, and distinct icons in a structured layout.
    Add to Wishlist
    Download
    AI Customize
    Comprehensive program dashboard featuring charts and gauges for quality, budget, risks, overall project map, progress, and resource updates.
    Free
    Add to Wishlist
    Download
    AI Customize
    Four black speedometers with white numbers and yellow markers arranged in a two by two grid with descriptions.
    Add to Wishlist
    Download
    AI Customize
    KPI infographic slide deck, combining line and bar graphs,  pie charts, and performance dials for data representation.
    Add to Wishlist
    Download
    AI Customize
    Semi circular gauge in shades of brown and peach with a pointer, alongside text and a silhouette group at the bottom.
    Free
    Add to Wishlist
    Download
    AI Customize
    An executive dashboard showing income and expense distribution, with key financial metrics and a line graph.
    Add to Wishlist
    Download
    AI Customize
    Semi circular gauge with six color coded sections from green to red, With numbers 01 to 06, labeled KPI at the bottom.
    Add to Wishlist
    Download
    AI Customize
    A collection of isometric KPI infographic slides showcasing bar graphs, pie charts, and performance metrics with icons.
    Add to Wishlist
    Download
    AI Customize
    Slide with blue stats on the left and various charts, including bar and pie charts in different colors.
    Add to Wishlist
    Download
    AI Customize
    KPI dashboard slide with key metrics for business, development, and downloads, showing percentages with icons.