Editable Waterfall PPT Presentation s & Google Slides

A waterfall chart slide displaying monthly data from january to june with captions on the right.
P.ID : 49645
    16 slides
    Set of ADKAR PowerPoint slides illustrating the steps in change management with colorful icons and descriptions.
    13 slides
    Slide deck of five ADKAR presentation templates, with various diagram styles each representing the key components.
    13 slides
    Collection of slides featuring circular diagrams with arrows in multiple colors, explaining the process steps.
    572 views
    96 Downloads
    Get Custom Slides by Experts
    Instantly Access Templates in PowerPoint

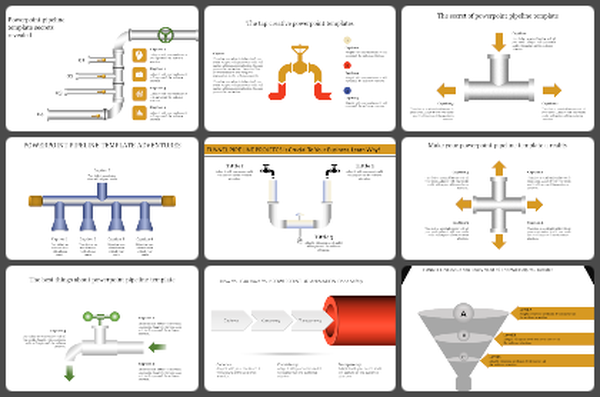
    Exclusive waterfall PowerPoint template

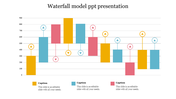
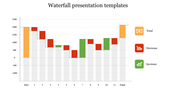
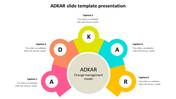
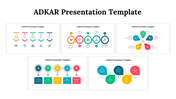
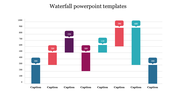
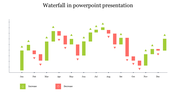
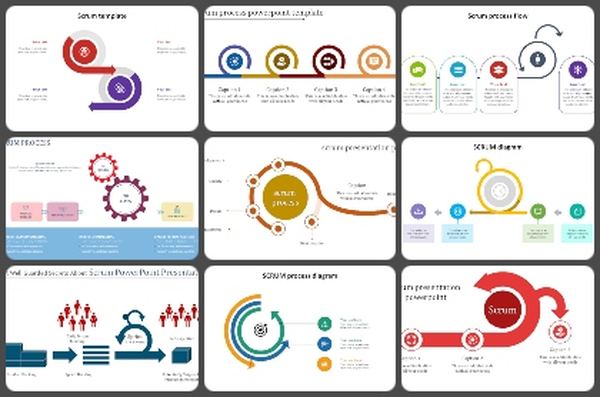
    The waterfall PowerPoint template can be an excellent help for reporting the observations and business reports. What is this template used for? This template can bring in more details of data analysis and data collected in a sales presentation. Try this fully customized template and make your presentation a success. Give this template a try. 

    Feature of the Template

    • 100% customizable slides
    • Easy to change the slide colors quickly.
    • It is easy to download.
    • Slides are available in different nodes & colors.
    • The slide contained 16:9 and 4:3 formats.
    • Well-crafted template with instant download facility.
    • Creative design with text area.
    Advertisement

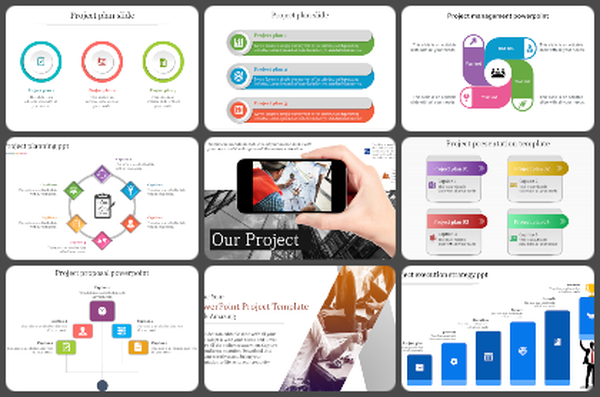
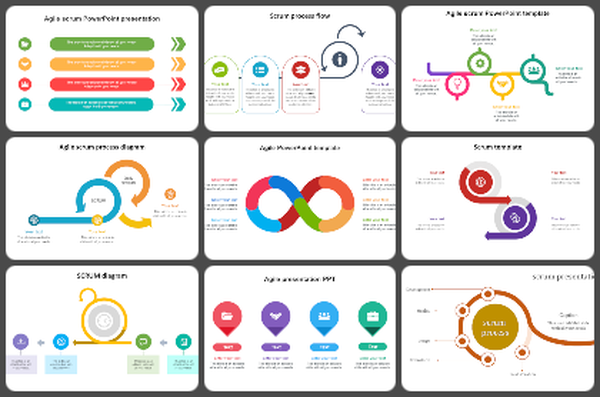
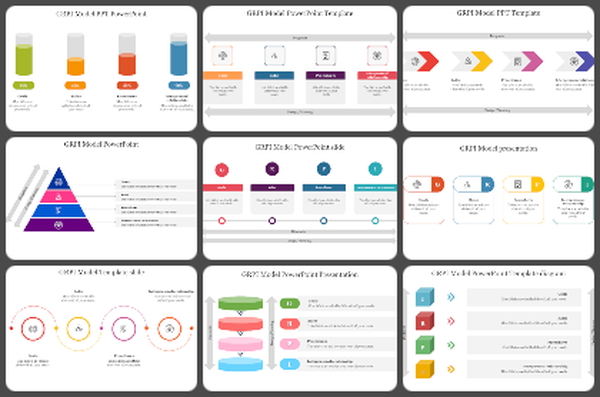
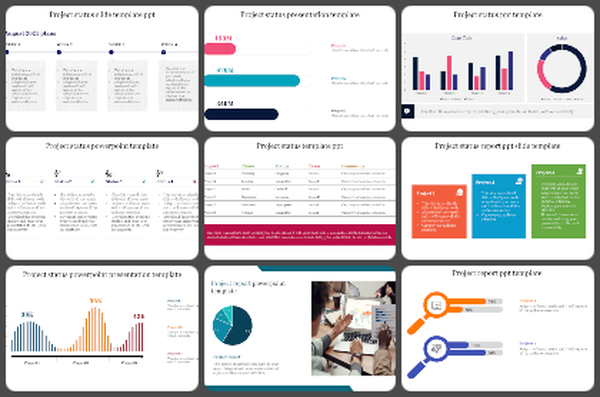
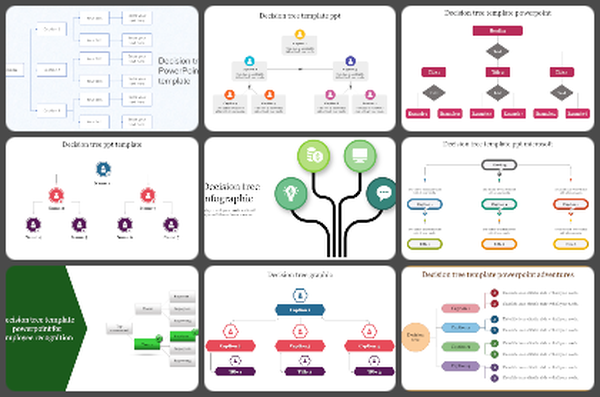
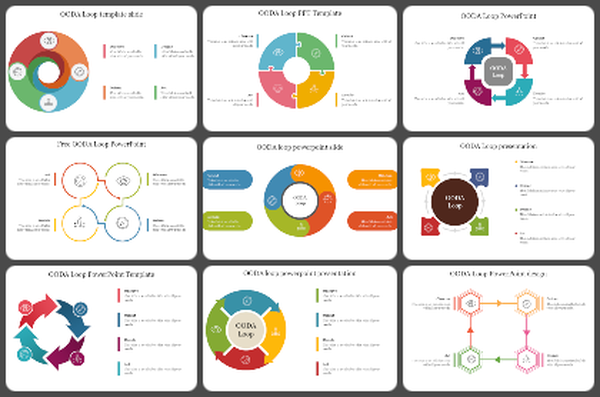
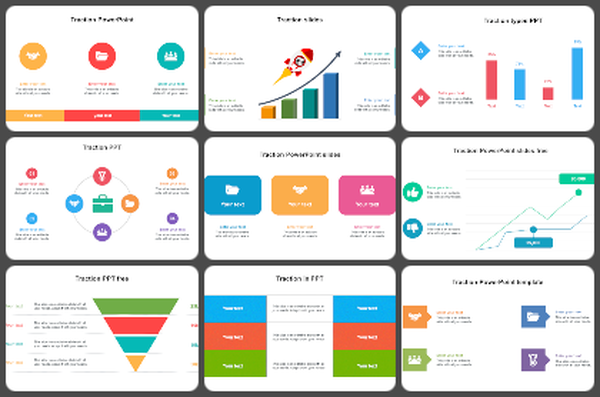
    You May Also Like These PowerPoint Templates

    Free
    Add to Wishlist
    Download
    AI Customize
    Colorful waterfall chart slide displaying increases and decreases across eight categories, with corresponding captions.
    Add to Wishlist
    Download
    AI Customize
    Waterfall chart with blue and yellow bars for annual changes, featuring placeholders for increase, decrease, and total.
    Add to Wishlist
    Download
    AI Customize
    Waterfall chart showing data fluctuations across 10 days with purple and pink bars and triangles.
    Free
    Add to Wishlist
    Download
    AI Customize
    Stacked bar chart of the waterfall model with color coded ranges low, mid, and high end across several days.
    Add to Wishlist
    Download
    AI Customize
    A waterfall chart with blue, yellow, and red bars shows monthly totals, increases, and decreases, ending at a final point
    Add to Wishlist
    Download
    AI Customize
    A slide featuring a waterfall chart, showing data changes in totals, increases, and decreases with textbox in various steps.
    Add to Wishlist
    Download
    AI Customize
    Waterfall PowerPoint chart displaying increases and decreases for eight items with color coded bars for each change.
    Add to Wishlist
    Download
    AI Customize
    IT Waterfall presentation slides featuring step-by-step process charts and placeholder captions in varied colors.
    Add to Wishlist
    Download
    AI Customize
    Waterfall Software Development Lifecycle PPT slides featuring colorful flowcharts that outline each stage with icons.
    Add to Wishlist
    Download
    AI Customize
    A detailed waterfall process flowchart slides showcasing stages with different colorful layout designs and icons.
    Add to Wishlist
    Download
    AI Customize
    Awesome Waterfall Chart Presentation Templates Design
    Add to Wishlist
    Download
    AI Customize
    Waterfall chart slide with eight multiple colored bars representing different values and captions below.
    Add to Wishlist
    Download
    AI Customize
    Waterfall PPT template with a bar chart showing monthly data from January to June in different colors on a white backdrop.
    Add to Wishlist
    Download
    AI Customize
    Waterfall Chart Infographics PowerPoint And Google Slides
    Add to Wishlist
    Download
    AI Customize
    A waterfall chart slide displaying monthly data from january to june with captions on the right.
    Add to Wishlist
    Download
    AI Customize
    Waterfall chart slide with three vertical bars in orange, blue, and pink, with captions in a legend at the bottom.