MILESTONE 🌟 5 Million+ creative minds trust SlideEgg! Grab 80% OFF

Best IT Waterfall PPT, Google Slides And Canva Templates

Pack of 16 slides
P.ID : 72591
Advertisement
154 views
39 Downloads
Get Custom Slides by Experts
Instantly Access Templates in PowerPoint

IT Waterfall PPT, Google Slides, And Canva Template


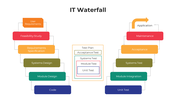
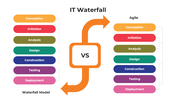
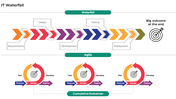
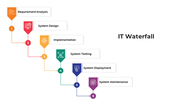
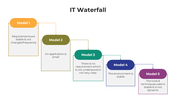
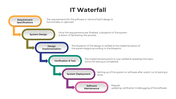
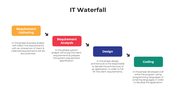
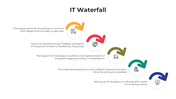
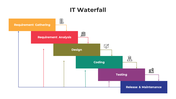
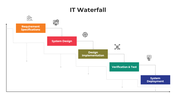
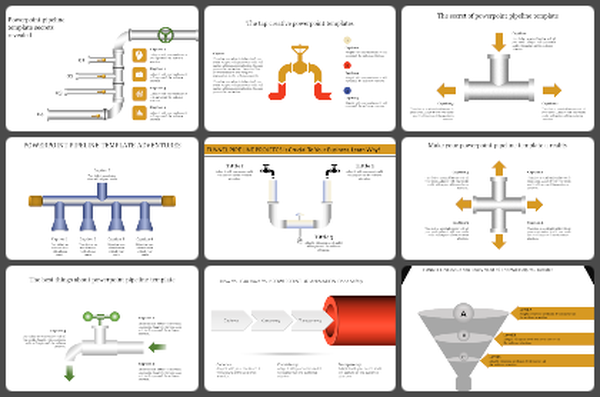
The IT Waterfall model, a traditional project management methodology, emphasizes a sequential design process. This approach is widely used in software development and IT projects, focusing on a linear progression through distinct phases such as requirements analysis, system design, implementation, testing, and maintenance.

Purpose Of The Slides

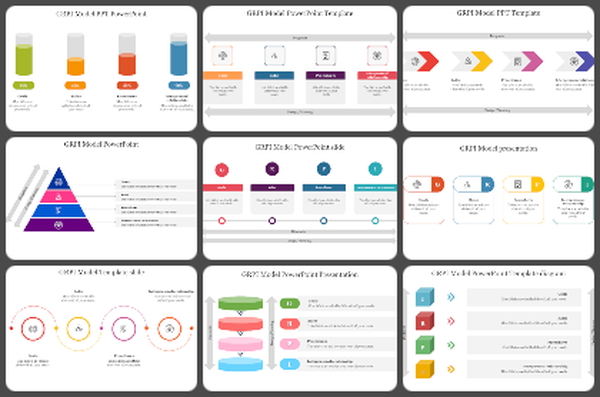
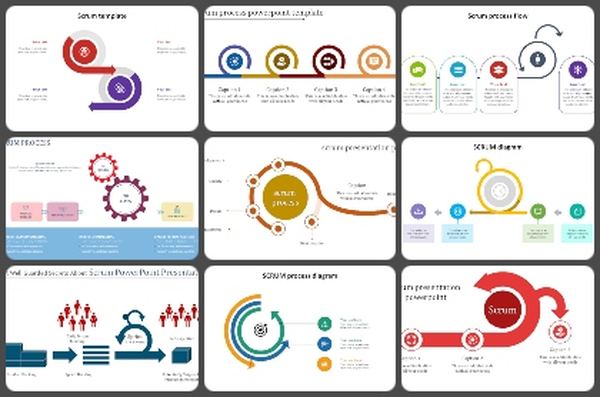
Our comprehensive deck of 10 IT Waterfall slides is designed to present detailed insights into this methodology. Each slide features unique infographic styles that make complex concepts easy to understand and visually engaging. The slides cover key phases of the Waterfall model, benefits and limitations, and practical examples, making them perfect for educational and professional presentations.

Who Can Use It?

This slide deck is ideal for IT professionals, project managers, students, and educators. Whether you're preparing for a presentation, conducting a workshop, or teaching project management concepts, these slides will help convey the IT Waterfall methodology clearly and effectively.

Special Key Features

The deck boasts a vibrant multicolor theme, with each slide offering customizable options to suit your specific needs. Its user-friendly design ensures that you can effortlessly adapt it to your presentation style.


Features of this template


  • 100% customizable slides and easy to download.
  • The slides contain 16:9 and 4:3 formats.
  • Easy to change the colors quickly.
  • Highly compatible with PowerPoint, Google Slides, and Canva templates.

You May Also Like These PowerPoint Templates

Add to Wishlist
Download
AI Customize
Red bullseye target inside a gray semi circle linked with five colorful circular icons with captions.
Add to Wishlist
Download
AI Customize
Slide with four blocks in red, green, blue, and yellow, each containing text and an icon representing project steps.
Add to Wishlist
Download
AI Customize
Eight numbered circles around a central octogon, each linked to management categories, arranged in a circular layout.
Add to Wishlist
Download
AI Customize
Circular diagram with four colored sections in green, blue, red, and orange, representing project phases.
Add to Wishlist
Download
AI Customize
Eight-step QFD template with distinct colored bars, each labeled with a step and placeholder text areas.
Free
Add to Wishlist
Download
AI Customize
Layered pyramid with five sections in different colors, and matching text boxes on the right.
Add to Wishlist
Download
AI Customize
 Colorful puzzle-shaped elements, each featuring icons and editable text spaces related to project management themes.
Add to Wishlist
Download
AI Customize
Project report status stages slide with icons showing reviewing, faults, goals, and target percentages.
Add to Wishlist
Download
AI Customize
Illustration of a woman with documents and hourglass in blue hues, with different task deadlines listed on the right.
Add to Wishlist
Download
AI Customize
Download the Best Project Planning PPT Presentation
Free
Add to Wishlist
Download
AI Customize
Waterfall slide showing multiple bars in varying colors with value labels and captions along the axis.
Add to Wishlist
Download
AI Customize
IT Waterfall presentation slides featuring step-by-step process charts and placeholder captions in varied colors.
Add to Wishlist
Download
AI Customize
Waterfall Software Development Lifecycle PPT slides featuring colorful flowcharts that outline each stage with icons.
Add to Wishlist
Download
AI Customize
A detailed waterfall process flowchart slides showcasing stages with different colorful layout designs and icons.
Add to Wishlist
Download
AI Customize
Awesome Waterfall Chart Presentation Templates Design
Add to Wishlist
Download
AI Customize
Waterfall chart slide with eight multiple colored bars representing different values and captions below.
Add to Wishlist
Download
AI Customize
Best Waterfall In PowerPoint Presentation Slide Designs
Add to Wishlist
Download
AI Customize
Waterfall PPT template with a bar chart showing monthly data from January to June in different colors on a white backdrop.
Add to Wishlist
Download
AI Customize
Waterfall Chart Infographics PowerPoint And Google Slides
Add to Wishlist
Download
AI Customize
A waterfall chart slide displaying monthly data from january to june with captions on the right.
Add to Wishlist
Download
AI Customize
Waterfall chart slide with three vertical bars in orange, blue, and pink, with captions in a legend at the bottom.
Add to Wishlist
Download
AI Customize
Bar chart in waterfall model format, featuring alternating blue, yellow, and pink columns, with captions below.
Add to Wishlist
Download
AI Customize
Slide featuring a chart with color-coded bars in orange, red, green tracking changes from start to finish.
Free
Add to Wishlist
Download
AI Customize
Colorful waterfall chart slide displaying increases and decreases across eight categories, with corresponding captions.
Add to Wishlist
Download
AI Customize
Waterfall chart with blue and yellow bars for annual changes, featuring placeholders for increase, decrease, and total.
Add to Wishlist
Download
AI Customize
Waterfall chart showing data fluctuations across 10 days with purple and pink bars and triangles.
Free
Add to Wishlist
Download
AI Customize
Stacked bar chart of the waterfall model with color coded ranges low, mid, and high end across several days.
Add to Wishlist
Download
AI Customize
A waterfall chart with blue, yellow, and red bars shows monthly totals, increases, and decreases, ending at a final point
Add to Wishlist
Download
AI Customize
A slide featuring a waterfall chart, showing data changes in totals, increases, and decreases with textbox in various steps.
Add to Wishlist
Download
AI Customize
Waterfall PowerPoint chart displaying increases and decreases for eight items with color coded bars for each change.