MILESTONE 🌟 5 Million+ creative minds trust SlideEgg! Grab 80% OFF

Schedule PowerPoint Presentation Template and Google Slides

A PowerPoint schedule slide displaying a 3 month timeline with task bars representing progress for each month with text area.
P.ID : 2725
    3.6K+ views
    492 Downloads
    Get Custom Slides by Experts
    Instantly Access Templates in PowerPoint

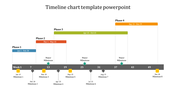
    Best PowerPoint  Schedule Template


    Would you like to schedule meetings for business and project plans? If yes, SlideEgg has come with the best collections of PowerPoint template schedule slides. This template is simple and designed with easy to understand schedule theme. You can add your day-to-day activities related to business and projects quickly using this pre-made template. It will not waste your time using this slide because it has all the needed data in it.


    It is a seven noded PowerPoint template schedule slide with green and white theme background. You also customize this chart PowerPoint template design, colors, and shapes to suit your presentation need. The template is also designed with beautiful icons to create an impressive presentation. You have separate color icons to differentiate data while referring to the schedule. Make use of this best template to create a mind-blowing PowerPoint presentation.


    Features of this template:


    • It is 100 % customizable slides and easy to download.
    • The Slides are available in different nodes & colors.
    • The slide contained in 16:9 and 4:3 format.
    • It is easy to change the slide colors quickly.
    • It is a well-crafted template with an instant download facility.
    • It is the best schedule theme template.

    Advertisement

    You May Also Like These PowerPoint Templates

    Add to Wishlist
    Download
    AI Customize
    Dashboard template with pink charts showing facebook and twitter activity, percentage rings, and a page growth graph.
    Add to Wishlist
    Download
    AI Customize
    Line chart template with two lines and labeled data points, along with caption blocks on the left.
    Add to Wishlist
    Download
    AI Customize
    A line graph showing a plot structure with key points marked by colored dots, representing key stages.
    Free
    Add to Wishlist
    Download
    AI Customize
    Slide deck showcasing KWL chart layouts with colorful sections in purple, yellow, and teal, for structured insights.
    Add to Wishlist
    Download
    AI Customize
    Chart guide slide with two green-tone line graphs displaying data points, captions on the right, and a text footer.
    Add to Wishlist
    Download
    AI Customize
    Steps to growth slide featuring a chart with four arrows indicating yearly growth percentages and a large text section.
    Add to Wishlist
    Download
    AI Customize
    KPI slide showcasing cash flow metrics and financial performance over six months in different bar chat layouts.
    Free
    Add to Wishlist
    Download
    AI Customize
    Comparison bar chart showing percentage values from 2011 to 2019 for chat and security categories.
    Add to Wishlist
    Download
    AI Customize
    Amazing Dashboard PowerPoint Template And Google Slides
    Add to Wishlist
    Download
    AI Customize
    Slide showcasing four circular progress charts with percentages in alternating teal and black accents.
    Add to Wishlist
    Download
    AI Customize
    Editable KPI Dashboard PowerPoint And Google Slides
    Free
    Add to Wishlist
    Download
    AI Customize
    A slide showing a colorful KWL chart with sections for knowledge, inquiry, and learning outcomes with placeholder text.
    Free
    Add to Wishlist
    Download
    AI Customize
    Pie chart presentation slide showing three charts with percentages with text placeholders.
    Free
    Add to Wishlist
    Download
    AI Customize
    Six charts in different formats, including line, pie, bar, and gauge, all in blue and gray, displaying data trends.
    Add to Wishlist
    Download
    AI Customize
    Project management dashboard slide showing colored charts for net worth, sector allocation, and various financial metrics.
    Add to Wishlist
    Download
    AI Customize
    A bar chart with four categories displaying stacked colored bars, representing three series in orange, blue, and red.
    Add to Wishlist
    Download
    AI Customize
    Circular chart with seven pastel colored segments, each with  icons and captions around it.
    Add to Wishlist
    Download
    AI Customize
    Circular progress indicators in purple, red, blue, and teal, each paired with a percentage and a relevant icon.
    Add to Wishlist
    Download
    AI Customize
    Project management dashboard slide with visually colored charts and graphs displaying task status with icons.