Speedometer KPI Dashboard Template PowerPoint

Semi circular gauge in shades of brown and peach with a pointer, alongside text and a silhouette group at the bottom.
P.ID : 1821
    2K+ views
    120 Downloads
    Get Custom Slides by Experts
    Instantly Access Templates in PowerPoint
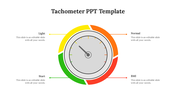
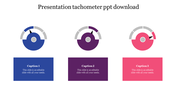
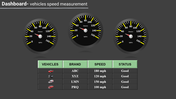
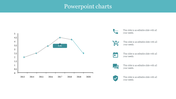
    Do you want to present your business analysis creatively and not know how to do it? No worries, we are here to provide you with the best template that will be a great asset in building up your slides. This KPI dashboard template is a visualization tool that business people use to know the progress and performance of their goals. The Speedometer animation creates interaction and develops new visions and goals. Based on the performance level, you can categorize your points in an arranged manner. On the whole, this is a valuable template, so buy it now.

    Features of this template

    • 100% customizable slides and easy to download
    • Slides are available in different nodes & colors.
    • The slides contained 16:9 and 4:3 formats.
    • Easy to change the slide colors quickly.
    • Well-crafted template with instant download facility.
    • Attractive animations are inserted.
    • Flexible Options are filled.
    Advertisement

    You May Also Like These PowerPoint Templates

    Free
    Add to Wishlist
    Download
    AI Customize
    Four blue pyramid shapes in ascending size, labeled with percentages, aligned over a horizontal gray bar.
    Add to Wishlist
    Download
    AI Customize
    Tachometer PowerPoint slide with gauges indicating 10, 20, and 30 with captions for each.
    Free
    Add to Wishlist
    Download
    AI Customize
    Dashboard with a timeline bar chart in green and purple, labeled with milestones for savings and investments.
    Add to Wishlist
    Download
    AI Customize
    A pie chart featuring five segments, each labeled with percentages, surrounded by text on a blue background.
    Add to Wishlist
    Download
    AI Customize
    Dashboard showing from defect rate trends upto delivery time analysis in mixed orange and brown theme.
    Add to Wishlist
    Download
    AI Customize
    KPI slide with four semi circular gauges displaying metrics and overlapping colored circles showing numerical data.
    Add to Wishlist
    Download
    AI Customize
    KPI dashboard layout with bar charts, a gauge, captions, and target metrics on light gray background, organized in sections.
    Add to Wishlist
    Download
    AI Customize
    Slide with two donut charts displaying values and a text section on the right with a blurred background image.
    Add to Wishlist
    Download
    AI Customize
    Concentric pentagons in black with text areas around each corner, forming a simple monochrome layout.
    Add to Wishlist
    Download
    AI Customize
    Horizontal infographic with four tachometer icons in gradient colors, labeled with captions for each gauge.
    Add to Wishlist
    Download
    AI Customize
    Slide featuring a tachometer dial with four performance levels and linked captions in red, yellow, maroon, and blue.
    Add to Wishlist
    Download
    AI Customize
    Dashboard layout with charts in orange tones, including a donut chart, bar graphs, and a line chart for monthly data.
    Add to Wishlist
    Download
    AI Customize
    Slide with four red speedometers, each indicating a different percentage level, against a white background.
    Add to Wishlist
    Download
    AI Customize
    Key performance indicator slide displaying data bars, percentages, and distinct icons in a structured layout.