Amazing Dashboard PowerPoint And Google Slides Template

Slide with blue stats on the left and various charts, including bar and pie charts in different colors.
P.ID : 1902
    2.5K+ views
    233 Downloads
    Get Custom Slides by Experts
    Instantly Access Templates in PowerPoint

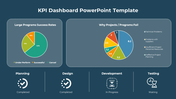
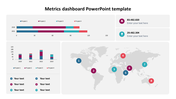
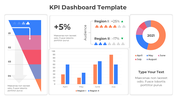
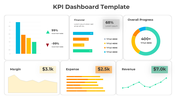
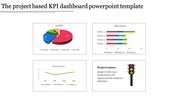
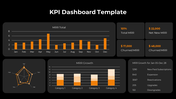
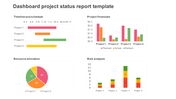
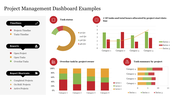
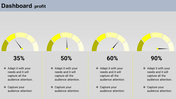
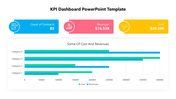
    Dashboard PowerPoint Template


    Get ready to supercharge your presentations with our incredible PowerPoint Dashboard templates! Imagine having a control center right at your fingertips, where you can effortlessly track and analyze important data. That's exactly what our Dashboard templates offer. They're like your secret weapon for presenting information in a visually captivating and easy-to-understand way. Whether you're a student, a professional, or someone who just loves data, our templates will help you create impressive dashboards that grab attention and make an impact. From tracking project progress to monitoring sales performance, our user-friendly templates will transform your presentations into engaging stories that bring data to life. So, buckle up, explore our professionally designed PowerPoint Dashboard templates, and get ready to impress your audience like never before!

    Features of the template 


    • 100% customizable slides and easy to download. 
    • Slides are available in different nodes & colors. 
    • The slide contains 16:9 and 4:3 formats. 
    • Easy to change the colors of the slides quickly. 
    • Well-crafted template with an instant download facility. 
    • Highly compatible with PowerPoint and Google Slides. 
    Advertisement

    You May Also Like These PowerPoint Templates

    Free
    Add to Wishlist
    Download
    AI Customize
    Marketing plan slide showing green bar chart with upward arrow, alongside three text and icons.
    Add to Wishlist
    Download
    AI Customize
    KPI dashboard slide with key metrics for business, development, and downloads, showing percentages with icons.
    Add to Wishlist
    Download
    AI Customize
    Customized PowerPoint Charts Template Presentation
    Add to Wishlist
    Download
    AI Customize
    Colorful pie chart with six segments, each labeled with percentages and color-coded text on the right.
    Add to Wishlist
    Download
    AI Customize
    A dashboard PPT slide with bar charts for Zantedeschia, Celosia, and Calendula, and three colorful gauge indicators.
    Add to Wishlist
    Download
    AI Customize
    Attractive PowerPoint KPI Dashboard Presentation Template
    Add to Wishlist
    Download
    AI Customize
    Dashboard presentation slide with a line chart trend and circular charts highlighting project progress percentages.
    Add to Wishlist
    Download
    AI Customize
    Dashboard gauge chart PPT template with color coded sections for big loss, loss, break even, profit, and high profit.
    Add to Wishlist
    Download
    AI Customize
    Internet speed dashboard featuring two routers with speed performance indicators and mobile phones.
    Add to Wishlist
    Download
    AI Customize
    Infographic charts for PowerPoint slide featuring bar, pie, and map charts in different styles and colors.
    Free
    Add to Wishlist
    Download
    AI Customize
    Red-themed circular gauge divided into five sections from direction to business, with a central needle indicator.
    Free
    Add to Wishlist
    Download
    AI Customize
    Five vertical purple bars in a row, each on a gray base, with a businesswoman figure on the right side.
    Add to Wishlist
    Download
    AI Customize
    Dashboard template displaying a sales performance bar chart, two process timing line graphs, and donut charts.
    Add to Wishlist
    Download
    AI Customize
    Executive dashboard slide with gender bar chart, line graph,pie chart, and area chart for executive data analysis.
    Free
    Add to Wishlist
    Download
    AI Customize
    Template with six green bar graphs labeled by years from 2016 to 2021, and a woman in a formal outfit.
    Free
    Add to Wishlist
    Download
    AI Customize
    Bar chart comparing business targets and profits across quarters, with orange and blue bars labeled by month.
    Add to Wishlist
    Download
    AI Customize
    Budget slide featuring a colorful donut chart with percentages and five categories with placeholder text.
    Add to Wishlist
    Download
    AI Customize
    Electricity dashboard showing a bar chart on the left and a line chart on the right, depicting electricity data.
    Add to Wishlist
    Download
    AI Customize
    Dashboard slide with three gauges displaying percentage levels, labeled low, middle, and high with placeholder text.