Best Logistics KPI Metrics PPT With Seven Nodes

Four semi circular charts showing shipment percentages by country, with icons below for delivery status and order rates.
P.ID : 52449
    2.3K+ views
    197 Downloads
    Get Custom Slides by Experts
    Instantly Access Templates in PowerPoint

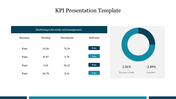
    Logistics KPI Metrics Presentation Slide

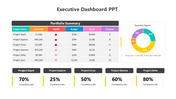
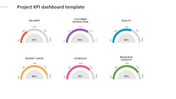
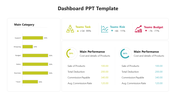
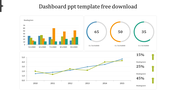
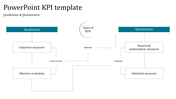
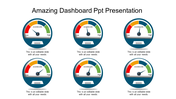
    Logistics KPI (Key Performance Indicator) Metrics are used to measure the performance and efficiency of logistics operations. They provide insights into critical aspects such as transportation costs, delivery times, and inventory management. This presentation on logistics KPI metrics provides a template for creating informative and engaging presentations that can help logistics professionals to optimize their operations. It covers key logistics KPI metrics, their definitions, and how to calculate and analyze them. The template also offers practical tips and strategies for using KPIs to improve logistics performance and achieve business objectives. The template can be customized for different audiences, from logistics managers to executives and stakeholders.

    Features of the template:

    • The slide are 100% customizable.
    • Easy to change the slide colors.
    • The template contains 16:9 and 4:3 formats.
    • Highly compatible with PowerPoint and Google Slides.
    • This slide has a colorful design pattern.
    Advertisement

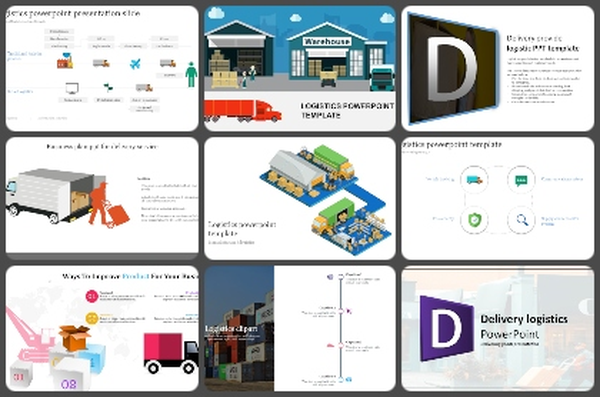
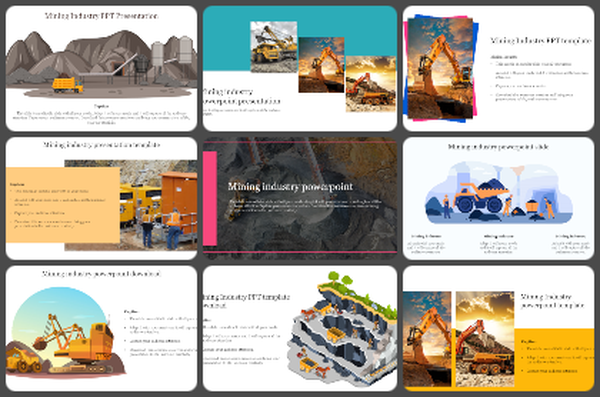
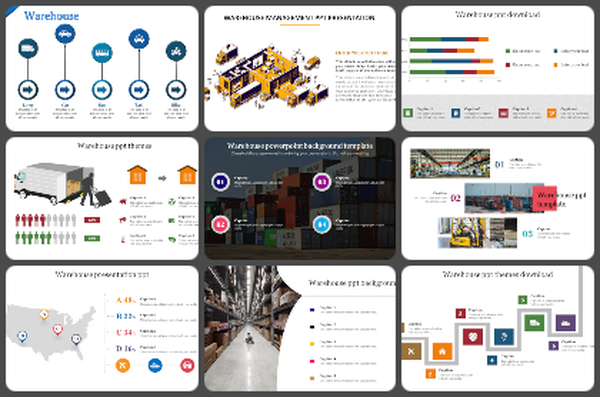
    You May Also Like These PowerPoint Templates

    Add to Wishlist
    Download
    AI Customize
    Dashboard slide showing sales bar chart with a highlighted value and a gauge representing business metrics.
    Add to Wishlist
    Download
    AI Customize
    KPI dashboard layout with blue and green line graphs at the top and shaded bar charts at the bottom in gradient colors.
    Add to Wishlist
    Download
    AI Customize
    Project dashboard with colorful bar charts, tables in red and purple, a circular gauge, and four blue phase icons below.
    Add to Wishlist
    Download
    AI Customize
    Creative KPI Dashboard PPT And Google Slides Template
    Add to Wishlist
    Download
    AI Customize
    KPI Dashboard PPT slide displaying project analysis, revenue, profitability, and gap analysis with data visualizations.
    Add to Wishlist
    Download
    AI Customize
    Business KPI dashboard showcasing charts for real estate and page views with pie, bar, and line graph visualizations.
    Add to Wishlist
    Download
    AI Customize
    Executive dashboard slide displaying many charts from new business to operational expenses.
    Add to Wishlist
    Download
    AI Customize
    Colorful infographic with a line graph, pie and bar chart, and numerical data panels in a structured KPI template design.
    Add to Wishlist
    Download
    AI Customize
    Dashboard template showing sales, orders, visitors, and users metrics with visual bar and pie charts for website analysis.
    Add to Wishlist
    Download
    AI Customize
    Dashboard template with a semi-circular gauge indicating performance with a blurred image and caption areas.
    Add to Wishlist
    Download
    AI Customize
    Project overview dashboard template with area chart, line charts for time intervals, and percentage indicators.
    Add to Wishlist
    Download
    AI Customize
    Dashboard graphics displaying vehicle speeds with a data table listing vehicles, brands, and status.
    Free
    Add to Wishlist
    Download
    AI Customize
    Dashboard with a timeline bar chart in green and purple, labeled with milestones for savings and investments.
    Add to Wishlist
    Download
    AI Customize
    Dashboard showing from defect rate trends upto delivery time analysis in mixed orange and brown theme.
    Add to Wishlist
    Download
    AI Customize
    KPI slide with four semi circular gauges displaying metrics and overlapping colored circles showing numerical data.
    Add to Wishlist
    Download
    AI Customize
    KPI dashboard layout with bar charts, a gauge, captions, and target metrics on light gray background, organized in sections.
    Add to Wishlist
    Download
    AI Customize
    Dashboard layout with charts in orange tones, including a donut chart, bar graphs, and a line chart for monthly data.