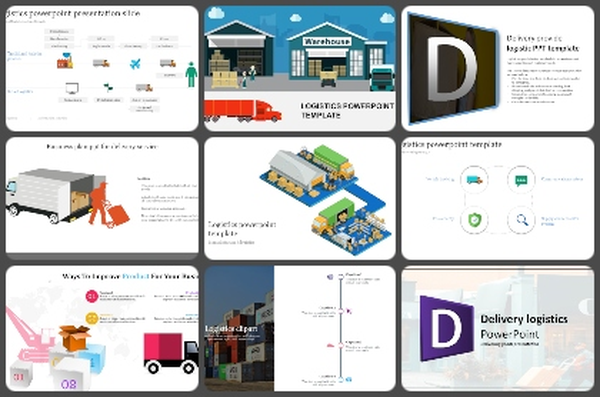
Logistics KPI PowerPoint Template and Google Slides


Best Logistics KPI PowerPoint Slide For Presentation
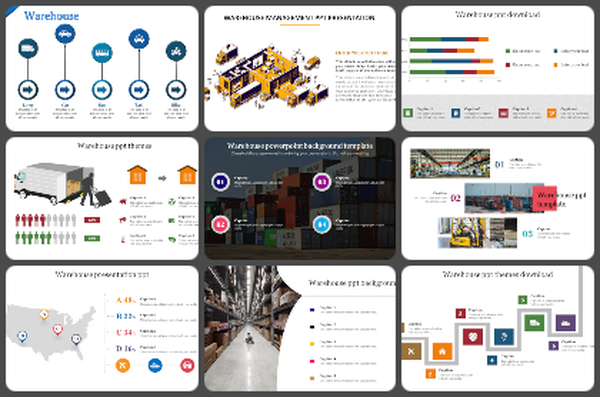
Download the logistics KPI PowerPoint template and use it for tracking the logistic process effectively. It is a useful tool that logistic managers can use to measure performance. In addition to that, the designs and the icons can be edited as per your desire.
About this template
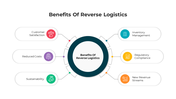
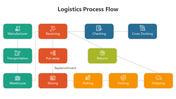
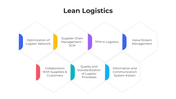
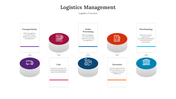
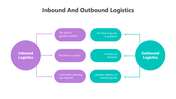
The logistics KPI PowerPoint template is a pre-designed slide. It is easy to follow and understand template. The circle design of this slide can give the complete logistic status from the beginning to the end. The seven multicolor circles hold the title to make the reader understand the process quickly. To download more KPI templates, visit SlideEgg.
Feature of this Template
1. 100% customizable slides and easy to download.
2. Slides available in different nodes & colors.
3. The slide contained 16:9 and 4:3 formats.
4. Easy to change the slide colors quickly.
5. Well-crafted template with instant download facility.
6. It is a well-designed presentation template.
7. Best slide for creative Presentation.


You May Also Like These PowerPoint Templates


